Belgian vs Immigrants from Latvia Unemployment
COMPARE
Belgian
Immigrants from Latvia
Unemployment
Unemployment Comparison
Belgians
Immigrants from Latvia
4.6%
UNEMPLOYMENT
100.0/ 100
METRIC RATING
13th/ 347
METRIC RANK
5.1%
UNEMPLOYMENT
88.0/ 100
METRIC RATING
129th/ 347
METRIC RANK
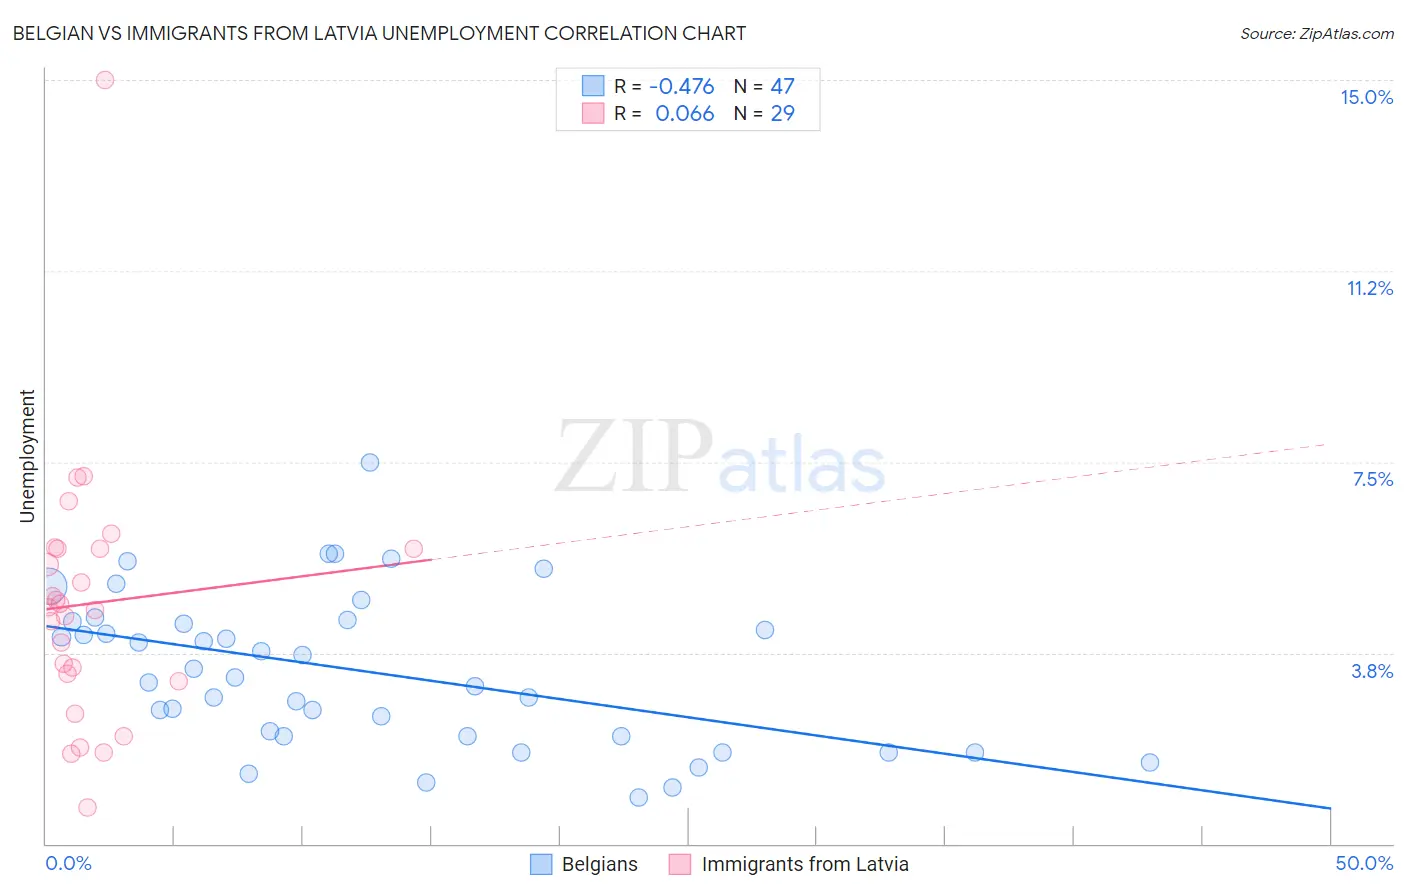
Belgian vs Immigrants from Latvia Unemployment Correlation Chart
The statistical analysis conducted on geographies consisting of 355,448,052 people shows a moderate negative correlation between the proportion of Belgians and unemployment in the United States with a correlation coefficient (R) of -0.476 and weighted average of 4.6%. Similarly, the statistical analysis conducted on geographies consisting of 113,721,061 people shows a slight positive correlation between the proportion of Immigrants from Latvia and unemployment in the United States with a correlation coefficient (R) of 0.066 and weighted average of 5.1%, a difference of 10.5%.
Unemployment Correlation Summary
| Measurement | Belgian | Immigrants from Latvia |
| Minimum | 0.90% | 0.70% |
| Maximum | 7.5% | 15.0% |
| Range | 6.6% | 14.3% |
| Mean | 3.4% | 4.7% |
| Median | 3.3% | 4.6% |
| Interquartile 25% (IQ1) | 2.1% | 3.3% |
| Interquartile 75% (IQ3) | 4.4% | 5.8% |
| Interquartile Range (IQR) | 2.3% | 2.5% |
| Standard Deviation (Sample) | 1.5% | 2.6% |
| Standard Deviation (Population) | 1.5% | 2.6% |
Similar Demographics by Unemployment
Demographics Similar to Belgians by Unemployment
In terms of unemployment, the demographic groups most similar to Belgians are Pennsylvania German (4.6%, a difference of 0.16%), Immigrants from Cuba (4.6%, a difference of 0.24%), English (4.6%, a difference of 0.26%), European (4.6%, a difference of 0.72%), and Chinese (4.7%, a difference of 0.86%).
| Demographics | Rating | Rank | Unemployment |
| Germans | 100.0 /100 | #6 | Exceptional 4.5% |
| Immigrants | India | 100.0 /100 | #7 | Exceptional 4.5% |
| Swiss | 100.0 /100 | #8 | Exceptional 4.5% |
| Scandinavians | 100.0 /100 | #9 | Exceptional 4.5% |
| Dutch | 100.0 /100 | #10 | Exceptional 4.6% |
| English | 100.0 /100 | #11 | Exceptional 4.6% |
| Pennsylvania Germans | 100.0 /100 | #12 | Exceptional 4.6% |
| Belgians | 100.0 /100 | #13 | Exceptional 4.6% |
| Immigrants | Cuba | 100.0 /100 | #14 | Exceptional 4.6% |
| Europeans | 99.9 /100 | #15 | Exceptional 4.6% |
| Chinese | 99.9 /100 | #16 | Exceptional 4.7% |
| Slovenes | 99.9 /100 | #17 | Exceptional 4.7% |
| Immigrants | Venezuela | 99.9 /100 | #18 | Exceptional 4.7% |
| Scottish | 99.9 /100 | #19 | Exceptional 4.7% |
| Carpatho Rusyns | 99.9 /100 | #20 | Exceptional 4.7% |
Demographics Similar to Immigrants from Latvia by Unemployment
In terms of unemployment, the demographic groups most similar to Immigrants from Latvia are Immigrants from Eastern Africa (5.1%, a difference of 0.0%), Kenyan (5.1%, a difference of 0.020%), Immigrants from Kenya (5.1%, a difference of 0.020%), Immigrants from Eastern Asia (5.1%, a difference of 0.040%), and Ethiopian (5.1%, a difference of 0.090%).
| Demographics | Rating | Rank | Unemployment |
| Immigrants | Switzerland | 89.1 /100 | #122 | Excellent 5.1% |
| Asians | 89.0 /100 | #123 | Excellent 5.1% |
| Ethiopians | 88.6 /100 | #124 | Excellent 5.1% |
| Immigrants | Eastern Asia | 88.3 /100 | #125 | Excellent 5.1% |
| Kenyans | 88.2 /100 | #126 | Excellent 5.1% |
| Immigrants | Kenya | 88.2 /100 | #127 | Excellent 5.1% |
| Immigrants | Eastern Africa | 88.1 /100 | #128 | Excellent 5.1% |
| Immigrants | Latvia | 88.0 /100 | #129 | Excellent 5.1% |
| Iranians | 86.9 /100 | #130 | Excellent 5.1% |
| Immigrants | Croatia | 86.8 /100 | #131 | Excellent 5.1% |
| Immigrants | Ethiopia | 86.7 /100 | #132 | Excellent 5.1% |
| Immigrants | Jordan | 86.6 /100 | #133 | Excellent 5.1% |
| Immigrants | Europe | 86.3 /100 | #134 | Excellent 5.1% |
| Immigrants | Burma/Myanmar | 86.2 /100 | #135 | Excellent 5.1% |
| Immigrants | Spain | 86.2 /100 | #136 | Excellent 5.1% |