Basque vs Yup'ik Median Earnings
COMPARE
Basque
Yup'ik
Median Earnings
Median Earnings Comparison
Basques
Yup'ik
$46,399
MEDIAN EARNINGS
48.8/ 100
METRIC RATING
175th/ 347
METRIC RANK
$35,942
MEDIAN EARNINGS
0.0/ 100
METRIC RATING
346th/ 347
METRIC RANK
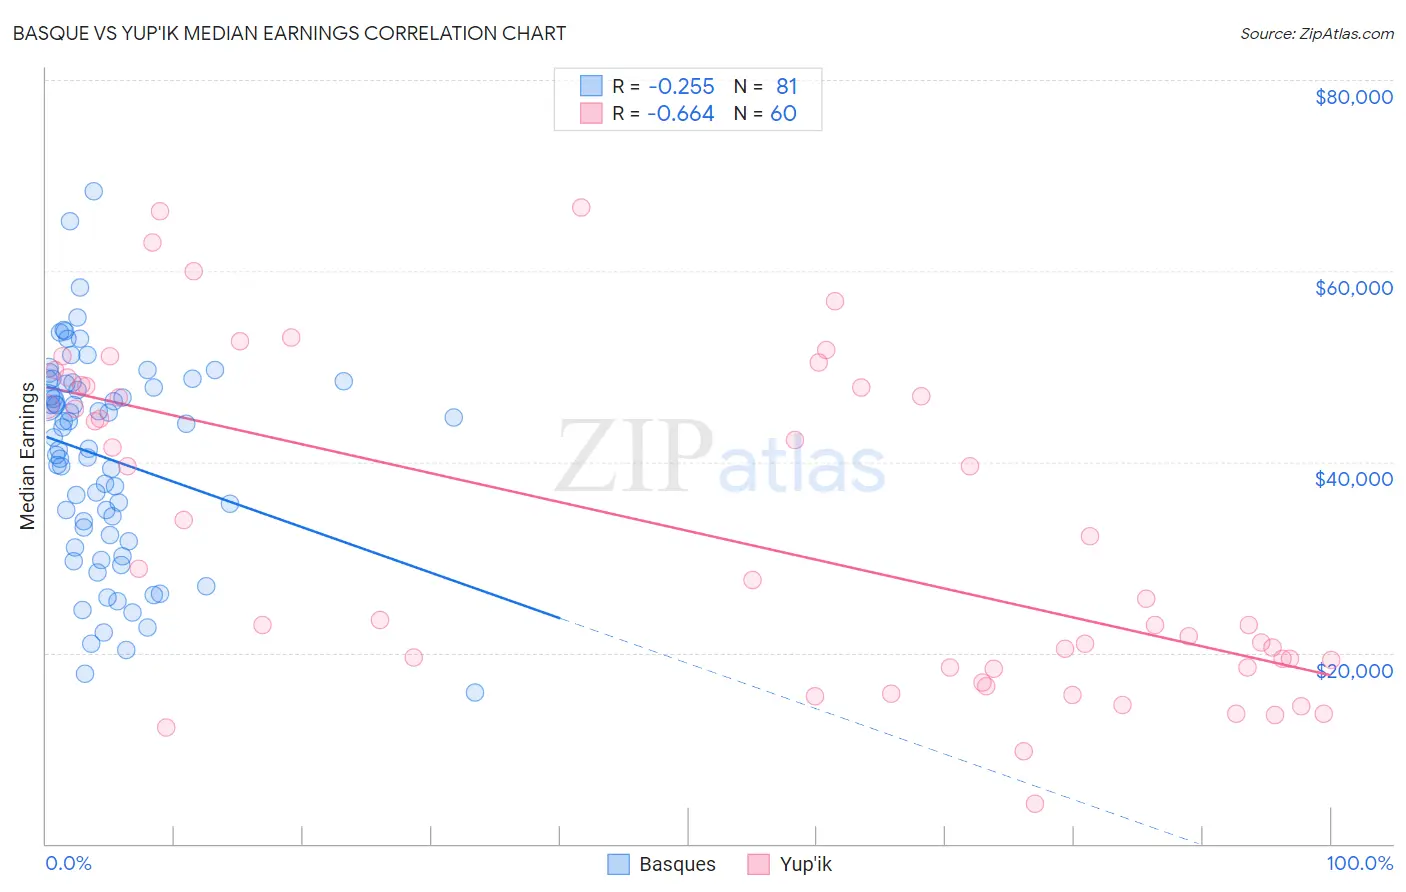
Basque vs Yup'ik Median Earnings Correlation Chart
The statistical analysis conducted on geographies consisting of 165,772,846 people shows a weak negative correlation between the proportion of Basques and median earnings in the United States with a correlation coefficient (R) of -0.255 and weighted average of $46,399. Similarly, the statistical analysis conducted on geographies consisting of 39,954,452 people shows a significant negative correlation between the proportion of Yup'ik and median earnings in the United States with a correlation coefficient (R) of -0.664 and weighted average of $35,942, a difference of 29.1%.
Median Earnings Correlation Summary
| Measurement | Basque | Yup'ik |
| Minimum | $15,833 | $4,192 |
| Maximum | $68,304 | $66,667 |
| Range | $52,471 | $62,475 |
| Mean | $40,382 | $32,584 |
| Median | $42,566 | $26,644 |
| Interquartile 25% (IQ1) | $32,007 | $18,448 |
| Interquartile 75% (IQ3) | $48,221 | $47,862 |
| Interquartile Range (IQR) | $16,214 | $29,414 |
| Standard Deviation (Sample) | $10,903 | $16,777 |
| Standard Deviation (Population) | $10,835 | $16,637 |
Similar Demographics by Median Earnings
Demographics Similar to Basques by Median Earnings
In terms of median earnings, the demographic groups most similar to Basques are Danish ($46,392, a difference of 0.020%), Belgian ($46,375, a difference of 0.050%), Scandinavian ($46,433, a difference of 0.070%), Ghanaian ($46,440, a difference of 0.090%), and Colombian ($46,349, a difference of 0.11%).
| Demographics | Rating | Rank | Median Earnings |
| Immigrants | Africa | 54.6 /100 | #168 | Average $46,564 |
| Immigrants | South America | 54.0 /100 | #169 | Average $46,548 |
| Immigrants | Immigrants | 51.6 /100 | #170 | Average $46,478 |
| Scottish | 51.1 /100 | #171 | Average $46,463 |
| Kenyans | 51.0 /100 | #172 | Average $46,462 |
| Ghanaians | 50.3 /100 | #173 | Average $46,440 |
| Scandinavians | 50.0 /100 | #174 | Average $46,433 |
| Basques | 48.8 /100 | #175 | Average $46,399 |
| Danes | 48.6 /100 | #176 | Average $46,392 |
| Belgians | 48.0 /100 | #177 | Average $46,375 |
| Colombians | 47.1 /100 | #178 | Average $46,349 |
| English | 46.5 /100 | #179 | Average $46,334 |
| Puget Sound Salish | 46.5 /100 | #180 | Average $46,333 |
| Immigrants | Cameroon | 46.4 /100 | #181 | Average $46,329 |
| Swiss | 45.9 /100 | #182 | Average $46,315 |
Demographics Similar to Yup'ik by Median Earnings
In terms of median earnings, the demographic groups most similar to Yup'ik are Puerto Rican ($35,560, a difference of 1.1%), Tohono O'odham ($36,349, a difference of 1.1%), Arapaho ($36,586, a difference of 1.8%), Pueblo ($36,859, a difference of 2.5%), and Hopi ($36,871, a difference of 2.6%).
| Demographics | Rating | Rank | Median Earnings |
| Houma | 0.0 /100 | #333 | Tragic $38,949 |
| Spanish American Indians | 0.0 /100 | #334 | Tragic $38,907 |
| Natives/Alaskans | 0.0 /100 | #335 | Tragic $38,896 |
| Crow | 0.0 /100 | #336 | Tragic $38,707 |
| Immigrants | Cuba | 0.0 /100 | #337 | Tragic $38,426 |
| Pima | 0.0 /100 | #338 | Tragic $38,285 |
| Menominee | 0.0 /100 | #339 | Tragic $37,884 |
| Navajo | 0.0 /100 | #340 | Tragic $36,999 |
| Lumbee | 0.0 /100 | #341 | Tragic $36,876 |
| Hopi | 0.0 /100 | #342 | Tragic $36,871 |
| Pueblo | 0.0 /100 | #343 | Tragic $36,859 |
| Arapaho | 0.0 /100 | #344 | Tragic $36,586 |
| Tohono O'odham | 0.0 /100 | #345 | Tragic $36,349 |
| Yup'ik | 0.0 /100 | #346 | Tragic $35,942 |
| Puerto Ricans | 0.0 /100 | #347 | Tragic $35,560 |