Basque vs Iroquois College, Under 1 year
COMPARE
Basque
Iroquois
College, Under 1 year
College, Under 1 year Comparison
Basques
Iroquois
67.6%
COLLEGE, UNDER 1 YEAR
95.2/ 100
METRIC RATING
115th/ 347
METRIC RANK
62.6%
COLLEGE, UNDER 1 YEAR
2.0/ 100
METRIC RATING
233rd/ 347
METRIC RANK
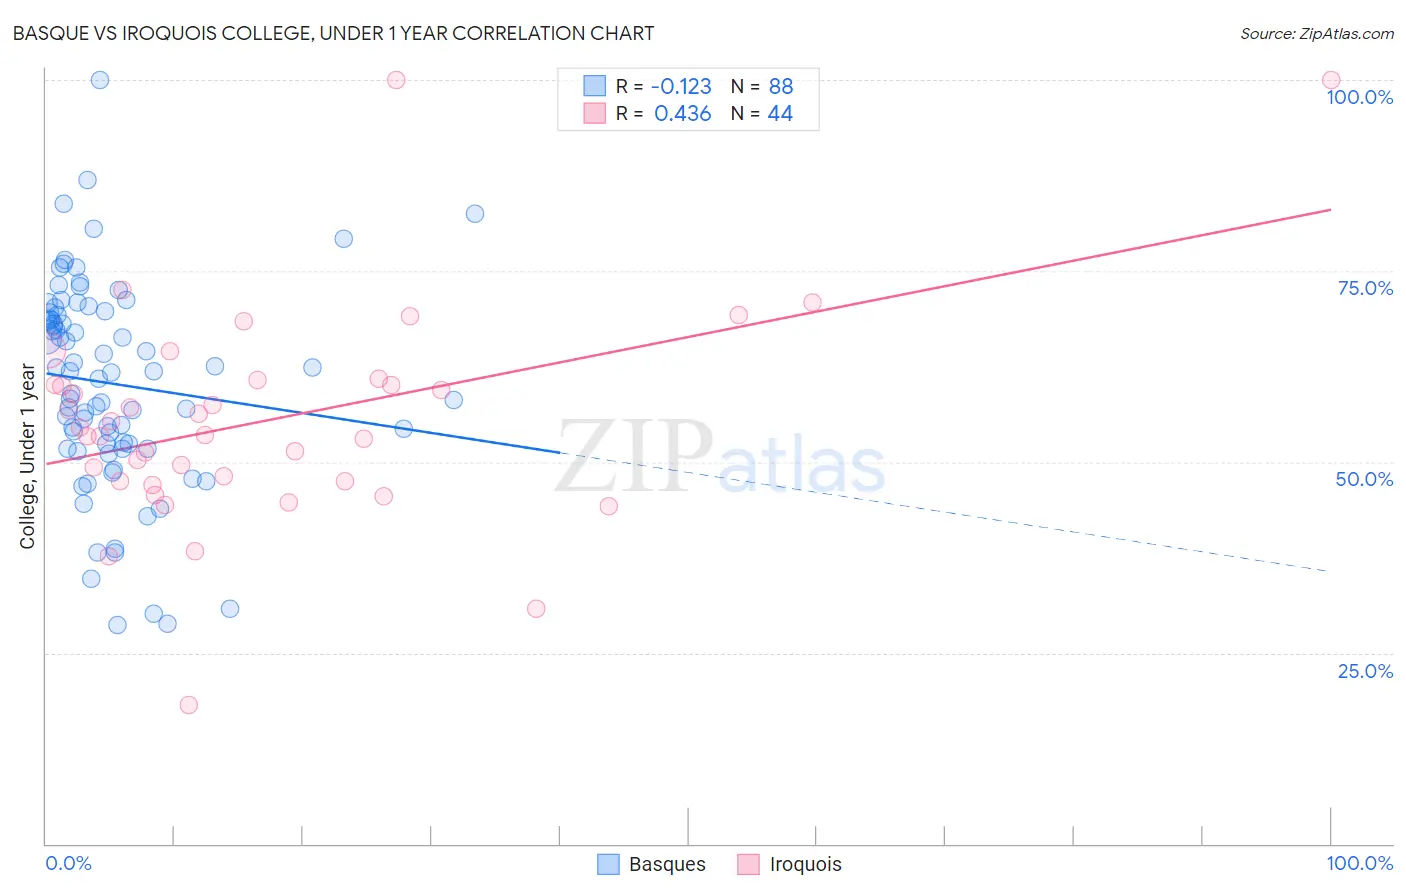
Basque vs Iroquois College, Under 1 year Correlation Chart
The statistical analysis conducted on geographies consisting of 165,778,801 people shows a poor negative correlation between the proportion of Basques and percentage of population with at least college, under 1 year education in the United States with a correlation coefficient (R) of -0.123 and weighted average of 67.6%. Similarly, the statistical analysis conducted on geographies consisting of 207,308,653 people shows a moderate positive correlation between the proportion of Iroquois and percentage of population with at least college, under 1 year education in the United States with a correlation coefficient (R) of 0.436 and weighted average of 62.6%, a difference of 7.9%.
College, Under 1 year Correlation Summary
| Measurement | Basque | Iroquois |
| Minimum | 28.6% | 18.2% |
| Maximum | 100.0% | 100.0% |
| Range | 71.4% | 81.8% |
| Mean | 60.2% | 55.5% |
| Median | 61.8% | 54.0% |
| Interquartile 25% (IQ1) | 52.1% | 47.4% |
| Interquartile 75% (IQ3) | 69.4% | 60.4% |
| Interquartile Range (IQR) | 17.3% | 13.0% |
| Standard Deviation (Sample) | 13.5% | 14.4% |
| Standard Deviation (Population) | 13.4% | 14.3% |
Similar Demographics by College, Under 1 year
Demographics Similar to Basques by College, Under 1 year
In terms of college, under 1 year, the demographic groups most similar to Basques are Chilean (67.6%, a difference of 0.010%), Immigrants from Nepal (67.5%, a difference of 0.080%), Syrian (67.6%, a difference of 0.090%), Pakistani (67.5%, a difference of 0.10%), and Macedonian (67.6%, a difference of 0.11%).
| Demographics | Rating | Rank | College, Under 1 year |
| Immigrants | Egypt | 96.0 /100 | #108 | Exceptional 67.7% |
| Scandinavians | 95.8 /100 | #109 | Exceptional 67.7% |
| Assyrians/Chaldeans/Syriacs | 95.8 /100 | #110 | Exceptional 67.7% |
| Ukrainians | 95.8 /100 | #111 | Exceptional 67.7% |
| Macedonians | 95.7 /100 | #112 | Exceptional 67.6% |
| Syrians | 95.6 /100 | #113 | Exceptional 67.6% |
| Chileans | 95.3 /100 | #114 | Exceptional 67.6% |
| Basques | 95.2 /100 | #115 | Exceptional 67.6% |
| Immigrants | Nepal | 94.9 /100 | #116 | Exceptional 67.5% |
| Pakistanis | 94.8 /100 | #117 | Exceptional 67.5% |
| Immigrants | Ukraine | 94.7 /100 | #118 | Exceptional 67.5% |
| Lebanese | 94.6 /100 | #119 | Exceptional 67.5% |
| Serbians | 93.9 /100 | #120 | Exceptional 67.4% |
| Slovenes | 93.3 /100 | #121 | Exceptional 67.3% |
| Immigrants | Jordan | 92.8 /100 | #122 | Exceptional 67.3% |
Demographics Similar to Iroquois by College, Under 1 year
In terms of college, under 1 year, the demographic groups most similar to Iroquois are Chippewa (62.6%, a difference of 0.030%), Spanish American (62.6%, a difference of 0.080%), Osage (62.7%, a difference of 0.12%), Immigrants (62.5%, a difference of 0.21%), and Immigrants from Western Africa (62.8%, a difference of 0.22%).
| Demographics | Rating | Rank | College, Under 1 year |
| Immigrants | Colombia | 4.0 /100 | #226 | Tragic 63.1% |
| Immigrants | Ghana | 3.7 /100 | #227 | Tragic 63.1% |
| Samoans | 3.3 /100 | #228 | Tragic 63.0% |
| Liberians | 3.2 /100 | #229 | Tragic 63.0% |
| Immigrants | Nonimmigrants | 3.0 /100 | #230 | Tragic 62.9% |
| Immigrants | Western Africa | 2.4 /100 | #231 | Tragic 62.8% |
| Osage | 2.2 /100 | #232 | Tragic 62.7% |
| Iroquois | 2.0 /100 | #233 | Tragic 62.6% |
| Chippewa | 2.0 /100 | #234 | Tragic 62.6% |
| Spanish Americans | 1.9 /100 | #235 | Tragic 62.6% |
| Immigrants | Immigrants | 1.7 /100 | #236 | Tragic 62.5% |
| Immigrants | Burma/Myanmar | 1.6 /100 | #237 | Tragic 62.5% |
| French American Indians | 1.5 /100 | #238 | Tragic 62.4% |
| Nepalese | 1.1 /100 | #239 | Tragic 62.2% |
| Aleuts | 1.1 /100 | #240 | Tragic 62.2% |