Basque vs Immigrants from Lebanon College, Under 1 year
COMPARE
Basque
Immigrants from Lebanon
College, Under 1 year
College, Under 1 year Comparison
Basques
Immigrants from Lebanon
67.6%
COLLEGE, UNDER 1 YEAR
95.2/ 100
METRIC RATING
115th/ 347
METRIC RANK
68.3%
COLLEGE, UNDER 1 YEAR
98.3/ 100
METRIC RATING
86th/ 347
METRIC RANK
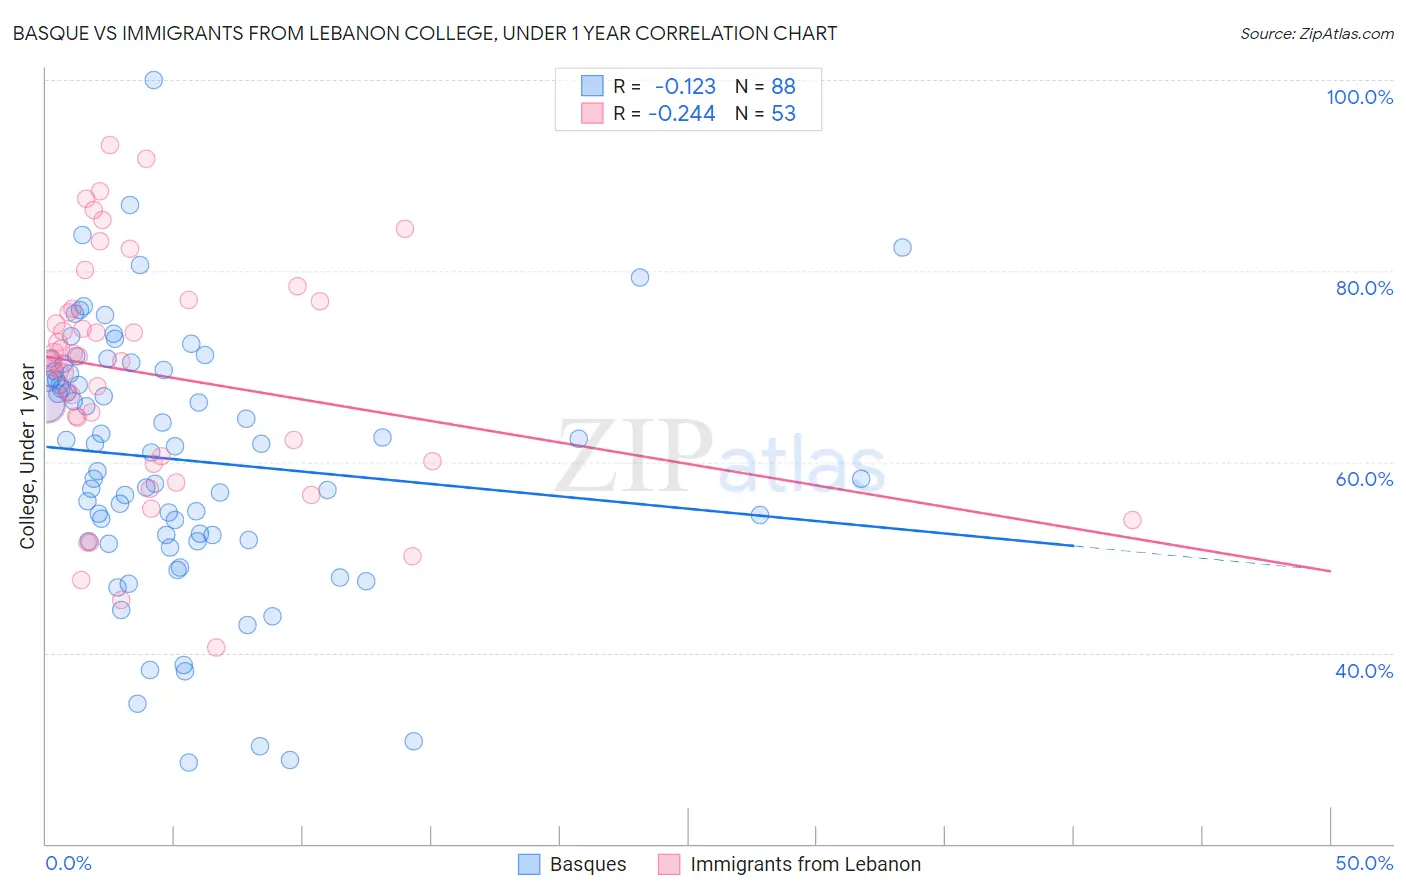
Basque vs Immigrants from Lebanon College, Under 1 year Correlation Chart
The statistical analysis conducted on geographies consisting of 165,778,801 people shows a poor negative correlation between the proportion of Basques and percentage of population with at least college, under 1 year education in the United States with a correlation coefficient (R) of -0.123 and weighted average of 67.6%. Similarly, the statistical analysis conducted on geographies consisting of 217,164,247 people shows a weak negative correlation between the proportion of Immigrants from Lebanon and percentage of population with at least college, under 1 year education in the United States with a correlation coefficient (R) of -0.244 and weighted average of 68.3%, a difference of 1.1%.
College, Under 1 year Correlation Summary
| Measurement | Basque | Immigrants from Lebanon |
| Minimum | 28.6% | 40.6% |
| Maximum | 100.0% | 93.2% |
| Range | 71.4% | 52.6% |
| Mean | 60.2% | 69.2% |
| Median | 61.8% | 70.6% |
| Interquartile 25% (IQ1) | 52.1% | 60.3% |
| Interquartile 75% (IQ3) | 69.4% | 76.5% |
| Interquartile Range (IQR) | 17.3% | 16.1% |
| Standard Deviation (Sample) | 13.5% | 12.1% |
| Standard Deviation (Population) | 13.4% | 12.0% |
Similar Demographics by College, Under 1 year
Demographics Similar to Basques by College, Under 1 year
In terms of college, under 1 year, the demographic groups most similar to Basques are Chilean (67.6%, a difference of 0.010%), Immigrants from Nepal (67.5%, a difference of 0.080%), Syrian (67.6%, a difference of 0.090%), Pakistani (67.5%, a difference of 0.10%), and Macedonian (67.6%, a difference of 0.11%).
| Demographics | Rating | Rank | College, Under 1 year |
| Immigrants | Egypt | 96.0 /100 | #108 | Exceptional 67.7% |
| Scandinavians | 95.8 /100 | #109 | Exceptional 67.7% |
| Assyrians/Chaldeans/Syriacs | 95.8 /100 | #110 | Exceptional 67.7% |
| Ukrainians | 95.8 /100 | #111 | Exceptional 67.7% |
| Macedonians | 95.7 /100 | #112 | Exceptional 67.6% |
| Syrians | 95.6 /100 | #113 | Exceptional 67.6% |
| Chileans | 95.3 /100 | #114 | Exceptional 67.6% |
| Basques | 95.2 /100 | #115 | Exceptional 67.6% |
| Immigrants | Nepal | 94.9 /100 | #116 | Exceptional 67.5% |
| Pakistanis | 94.8 /100 | #117 | Exceptional 67.5% |
| Immigrants | Ukraine | 94.7 /100 | #118 | Exceptional 67.5% |
| Lebanese | 94.6 /100 | #119 | Exceptional 67.5% |
| Serbians | 93.9 /100 | #120 | Exceptional 67.4% |
| Slovenes | 93.3 /100 | #121 | Exceptional 67.3% |
| Immigrants | Jordan | 92.8 /100 | #122 | Exceptional 67.3% |
Demographics Similar to Immigrants from Lebanon by College, Under 1 year
In terms of college, under 1 year, the demographic groups most similar to Immigrants from Lebanon are Egyptian (68.3%, a difference of 0.0%), Immigrants from Hungary (68.3%, a difference of 0.010%), Chinese (68.3%, a difference of 0.020%), Argentinean (68.4%, a difference of 0.030%), and Croatian (68.3%, a difference of 0.040%).
| Demographics | Rating | Rank | College, Under 1 year |
| Greeks | 98.6 /100 | #79 | Exceptional 68.5% |
| Immigrants | Spain | 98.5 /100 | #80 | Exceptional 68.4% |
| Immigrants | Greece | 98.5 /100 | #81 | Exceptional 68.4% |
| Norwegians | 98.4 /100 | #82 | Exceptional 68.4% |
| Argentineans | 98.4 /100 | #83 | Exceptional 68.4% |
| Immigrants | Hungary | 98.3 /100 | #84 | Exceptional 68.3% |
| Egyptians | 98.3 /100 | #85 | Exceptional 68.3% |
| Immigrants | Lebanon | 98.3 /100 | #86 | Exceptional 68.3% |
| Chinese | 98.3 /100 | #87 | Exceptional 68.3% |
| Croatians | 98.2 /100 | #88 | Exceptional 68.3% |
| Ethiopians | 98.2 /100 | #89 | Exceptional 68.3% |
| Icelanders | 98.1 /100 | #90 | Exceptional 68.3% |
| Europeans | 98.1 /100 | #91 | Exceptional 68.2% |
| Luxembourgers | 98.1 /100 | #92 | Exceptional 68.2% |
| Romanians | 97.9 /100 | #93 | Exceptional 68.2% |