Immigrants from Pakistan vs Immigrants from Mexico Bachelor's Degree
COMPARE
Immigrants from Pakistan
Immigrants from Mexico
Bachelor's Degree
Bachelor's Degree Comparison
Immigrants from Pakistan
Immigrants from Mexico
43.1%
BACHELOR'S DEGREE
99.7/ 100
METRIC RATING
69th/ 347
METRIC RANK
26.1%
BACHELOR'S DEGREE
0.0/ 100
METRIC RATING
336th/ 347
METRIC RANK
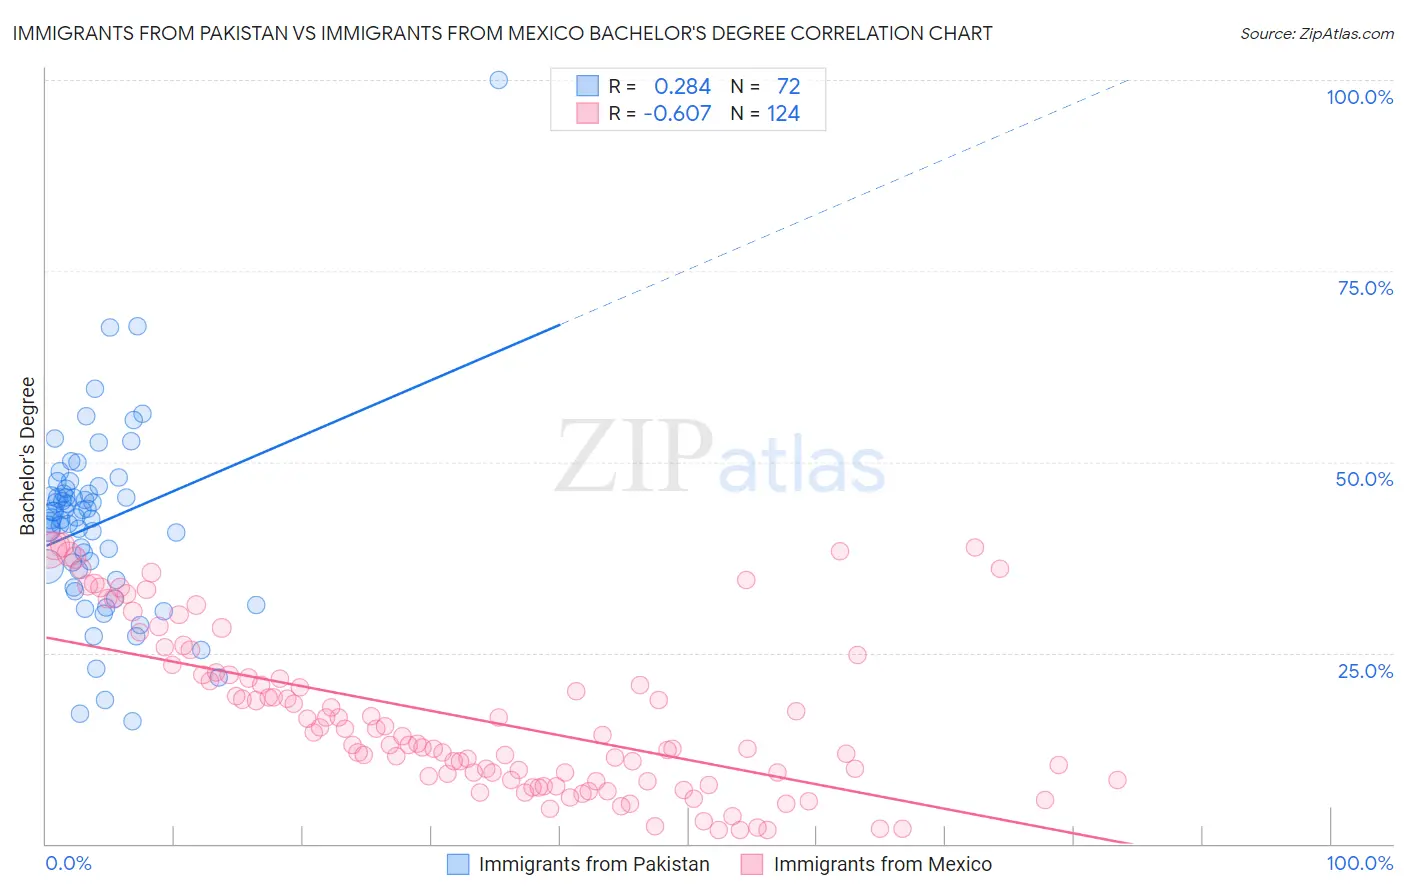
Immigrants from Pakistan vs Immigrants from Mexico Bachelor's Degree Correlation Chart
The statistical analysis conducted on geographies consisting of 283,898,277 people shows a weak positive correlation between the proportion of Immigrants from Pakistan and percentage of population with at least bachelor's degree education in the United States with a correlation coefficient (R) of 0.284 and weighted average of 43.1%. Similarly, the statistical analysis conducted on geographies consisting of 513,639,640 people shows a significant negative correlation between the proportion of Immigrants from Mexico and percentage of population with at least bachelor's degree education in the United States with a correlation coefficient (R) of -0.607 and weighted average of 26.1%, a difference of 65.0%.
Bachelor's Degree Correlation Summary
| Measurement | Immigrants from Pakistan | Immigrants from Mexico |
| Minimum | 16.0% | 1.8% |
| Maximum | 100.0% | 39.1% |
| Range | 84.0% | 37.4% |
| Mean | 42.0% | 16.7% |
| Median | 42.6% | 13.6% |
| Interquartile 25% (IQ1) | 35.2% | 8.4% |
| Interquartile 75% (IQ3) | 46.2% | 22.3% |
| Interquartile Range (IQR) | 11.0% | 13.9% |
| Standard Deviation (Sample) | 12.4% | 10.6% |
| Standard Deviation (Population) | 12.4% | 10.5% |
Similar Demographics by Bachelor's Degree
Demographics Similar to Immigrants from Pakistan by Bachelor's Degree
In terms of bachelor's degree, the demographic groups most similar to Immigrants from Pakistan are Immigrants from Indonesia (43.3%, a difference of 0.26%), Egyptian (43.3%, a difference of 0.28%), Immigrants from Netherlands (43.3%, a difference of 0.30%), Zimbabwean (43.3%, a difference of 0.32%), and Argentinean (43.3%, a difference of 0.33%).
| Demographics | Rating | Rank | Bachelor's Degree |
| Immigrants | Kazakhstan | 99.8 /100 | #62 | Exceptional 43.4% |
| Immigrants | Europe | 99.8 /100 | #63 | Exceptional 43.4% |
| Argentineans | 99.7 /100 | #64 | Exceptional 43.3% |
| Zimbabweans | 99.7 /100 | #65 | Exceptional 43.3% |
| Immigrants | Netherlands | 99.7 /100 | #66 | Exceptional 43.3% |
| Egyptians | 99.7 /100 | #67 | Exceptional 43.3% |
| Immigrants | Indonesia | 99.7 /100 | #68 | Exceptional 43.3% |
| Immigrants | Pakistan | 99.7 /100 | #69 | Exceptional 43.1% |
| Immigrants | Romania | 99.6 /100 | #70 | Exceptional 42.9% |
| Immigrants | Argentina | 99.6 /100 | #71 | Exceptional 42.8% |
| Ethiopians | 99.5 /100 | #72 | Exceptional 42.8% |
| Immigrants | Uzbekistan | 99.5 /100 | #73 | Exceptional 42.8% |
| Bhutanese | 99.5 /100 | #74 | Exceptional 42.7% |
| Immigrants | Zimbabwe | 99.4 /100 | #75 | Exceptional 42.6% |
| Immigrants | Egypt | 99.4 /100 | #76 | Exceptional 42.6% |
Demographics Similar to Immigrants from Mexico by Bachelor's Degree
In terms of bachelor's degree, the demographic groups most similar to Immigrants from Mexico are Native/Alaskan (26.3%, a difference of 0.70%), Inupiat (25.8%, a difference of 1.3%), Arapaho (26.6%, a difference of 1.9%), Pueblo (25.5%, a difference of 2.4%), and Hopi (25.3%, a difference of 3.3%).
| Demographics | Rating | Rank | Bachelor's Degree |
| Immigrants | Central America | 0.0 /100 | #329 | Tragic 27.5% |
| Spanish American Indians | 0.0 /100 | #330 | Tragic 27.5% |
| Immigrants | Azores | 0.0 /100 | #331 | Tragic 27.3% |
| Menominee | 0.0 /100 | #332 | Tragic 27.3% |
| Mexicans | 0.0 /100 | #333 | Tragic 27.1% |
| Arapaho | 0.0 /100 | #334 | Tragic 26.6% |
| Natives/Alaskans | 0.0 /100 | #335 | Tragic 26.3% |
| Immigrants | Mexico | 0.0 /100 | #336 | Tragic 26.1% |
| Inupiat | 0.0 /100 | #337 | Tragic 25.8% |
| Pueblo | 0.0 /100 | #338 | Tragic 25.5% |
| Hopi | 0.0 /100 | #339 | Tragic 25.3% |
| Lumbee | 0.0 /100 | #340 | Tragic 24.8% |
| Yuman | 0.0 /100 | #341 | Tragic 24.5% |
| Yakama | 0.0 /100 | #342 | Tragic 24.5% |
| Tohono O'odham | 0.0 /100 | #343 | Tragic 24.4% |