Basque vs Immigrants from Kuwait Master's Degree
COMPARE
Basque
Immigrants from Kuwait
Master's Degree
Master's Degree Comparison
Basques
Immigrants from Kuwait
14.7%
MASTER'S DEGREE
36.5/ 100
METRIC RATING
187th/ 347
METRIC RANK
18.6%
MASTER'S DEGREE
100.0/ 100
METRIC RATING
52nd/ 347
METRIC RANK
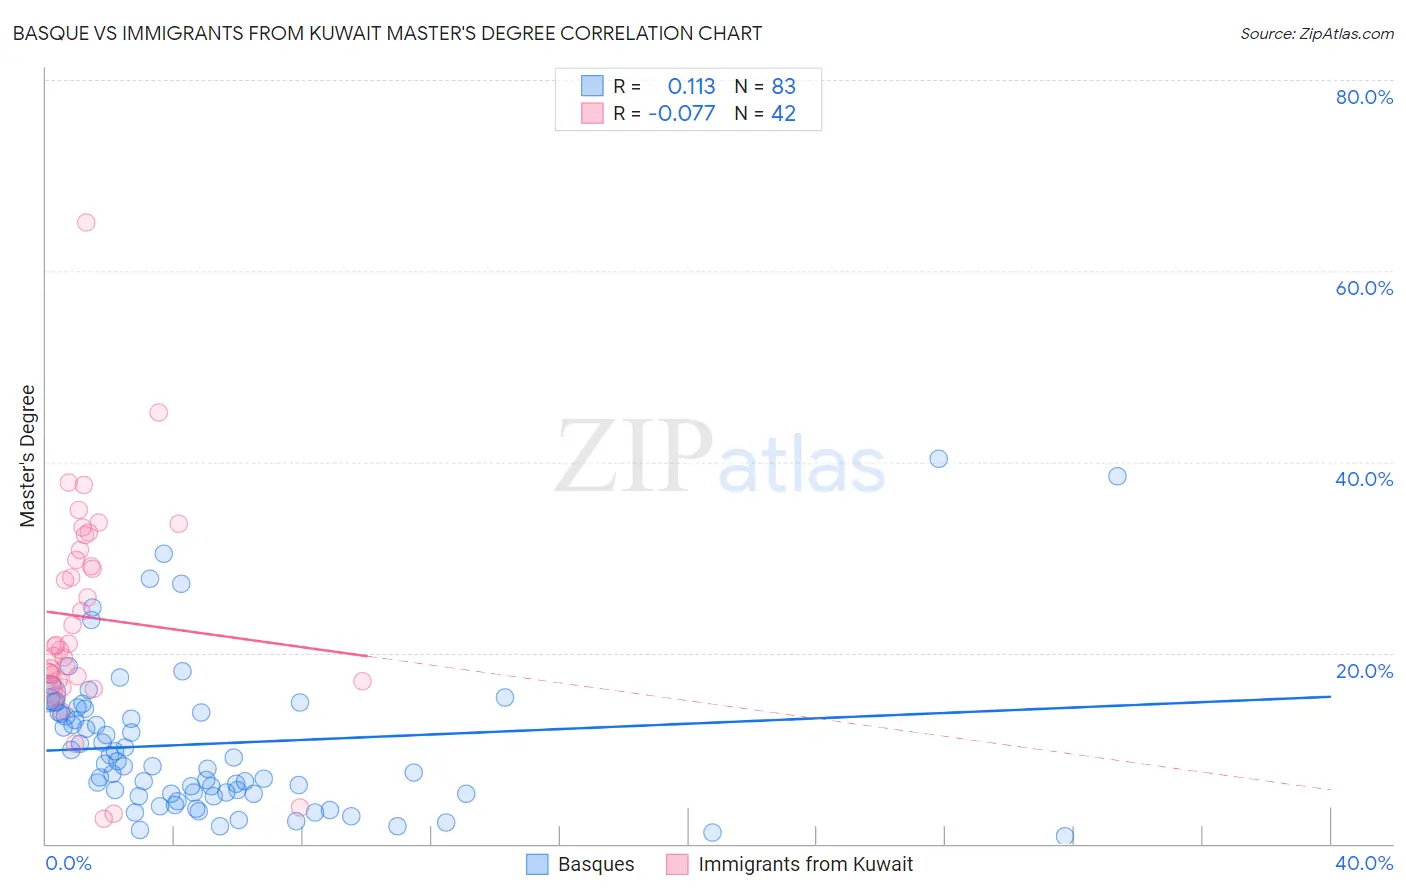
Basque vs Immigrants from Kuwait Master's Degree Correlation Chart
The statistical analysis conducted on geographies consisting of 165,765,652 people shows a poor positive correlation between the proportion of Basques and percentage of population with at least master's degree education in the United States with a correlation coefficient (R) of 0.113 and weighted average of 14.7%. Similarly, the statistical analysis conducted on geographies consisting of 136,916,630 people shows a slight negative correlation between the proportion of Immigrants from Kuwait and percentage of population with at least master's degree education in the United States with a correlation coefficient (R) of -0.077 and weighted average of 18.6%, a difference of 26.7%.
Master's Degree Correlation Summary
| Measurement | Basque | Immigrants from Kuwait |
| Minimum | 0.80% | 2.6% |
| Maximum | 40.4% | 65.1% |
| Range | 39.6% | 62.5% |
| Mean | 10.5% | 23.7% |
| Median | 8.4% | 20.7% |
| Interquartile 25% (IQ1) | 5.2% | 17.1% |
| Interquartile 75% (IQ3) | 14.1% | 30.8% |
| Interquartile Range (IQR) | 8.9% | 13.7% |
| Standard Deviation (Sample) | 7.8% | 11.5% |
| Standard Deviation (Population) | 7.8% | 11.4% |
Similar Demographics by Master's Degree
Demographics Similar to Basques by Master's Degree
In terms of master's degree, the demographic groups most similar to Basques are Immigrants from Costa Rica (14.7%, a difference of 0.040%), Immigrants from Oceania (14.7%, a difference of 0.080%), Immigrants (14.6%, a difference of 0.080%), Spaniard (14.6%, a difference of 0.10%), and Barbadian (14.7%, a difference of 0.24%).
| Demographics | Rating | Rank | Master's Degree |
| Celtics | 41.3 /100 | #180 | Average 14.8% |
| Swiss | 41.1 /100 | #181 | Average 14.7% |
| Czechs | 40.4 /100 | #182 | Average 14.7% |
| Sri Lankans | 39.6 /100 | #183 | Fair 14.7% |
| Immigrants | Zaire | 39.5 /100 | #184 | Fair 14.7% |
| Barbadians | 38.3 /100 | #185 | Fair 14.7% |
| Immigrants | Oceania | 37.1 /100 | #186 | Fair 14.7% |
| Basques | 36.5 /100 | #187 | Fair 14.7% |
| Immigrants | Costa Rica | 36.2 /100 | #188 | Fair 14.7% |
| Immigrants | Immigrants | 36.0 /100 | #189 | Fair 14.6% |
| Spaniards | 35.8 /100 | #190 | Fair 14.6% |
| Welsh | 34.2 /100 | #191 | Fair 14.6% |
| Immigrants | Middle Africa | 33.6 /100 | #192 | Fair 14.6% |
| Immigrants | Nigeria | 32.7 /100 | #193 | Fair 14.6% |
| Chinese | 32.5 /100 | #194 | Fair 14.6% |
Demographics Similar to Immigrants from Kuwait by Master's Degree
In terms of master's degree, the demographic groups most similar to Immigrants from Kuwait are Immigrants from Czechoslovakia (18.5%, a difference of 0.080%), Immigrants from Lithuania (18.5%, a difference of 0.39%), Immigrants from Serbia (18.5%, a difference of 0.42%), Asian (18.4%, a difference of 0.65%), and Immigrants from Asia (18.4%, a difference of 0.79%).
| Demographics | Rating | Rank | Master's Degree |
| Immigrants | Belarus | 100.0 /100 | #45 | Exceptional 18.9% |
| Immigrants | Norway | 100.0 /100 | #46 | Exceptional 18.8% |
| Immigrants | Austria | 100.0 /100 | #47 | Exceptional 18.8% |
| Paraguayans | 100.0 /100 | #48 | Exceptional 18.8% |
| Estonians | 100.0 /100 | #49 | Exceptional 18.8% |
| Bulgarians | 100.0 /100 | #50 | Exceptional 18.8% |
| Immigrants | South Africa | 100.0 /100 | #51 | Exceptional 18.8% |
| Immigrants | Kuwait | 100.0 /100 | #52 | Exceptional 18.6% |
| Immigrants | Czechoslovakia | 99.9 /100 | #53 | Exceptional 18.5% |
| Immigrants | Lithuania | 99.9 /100 | #54 | Exceptional 18.5% |
| Immigrants | Serbia | 99.9 /100 | #55 | Exceptional 18.5% |
| Asians | 99.9 /100 | #56 | Exceptional 18.4% |
| Immigrants | Asia | 99.9 /100 | #57 | Exceptional 18.4% |
| Australians | 99.9 /100 | #58 | Exceptional 18.4% |
| Immigrants | Bulgaria | 99.9 /100 | #59 | Exceptional 18.3% |