Basque vs Immigrants from Sri Lanka Master's Degree
COMPARE
Basque
Immigrants from Sri Lanka
Master's Degree
Master's Degree Comparison
Basques
Immigrants from Sri Lanka
14.7%
MASTER'S DEGREE
36.5/ 100
METRIC RATING
187th/ 347
METRIC RANK
19.9%
MASTER'S DEGREE
100.0/ 100
METRIC RATING
27th/ 347
METRIC RANK
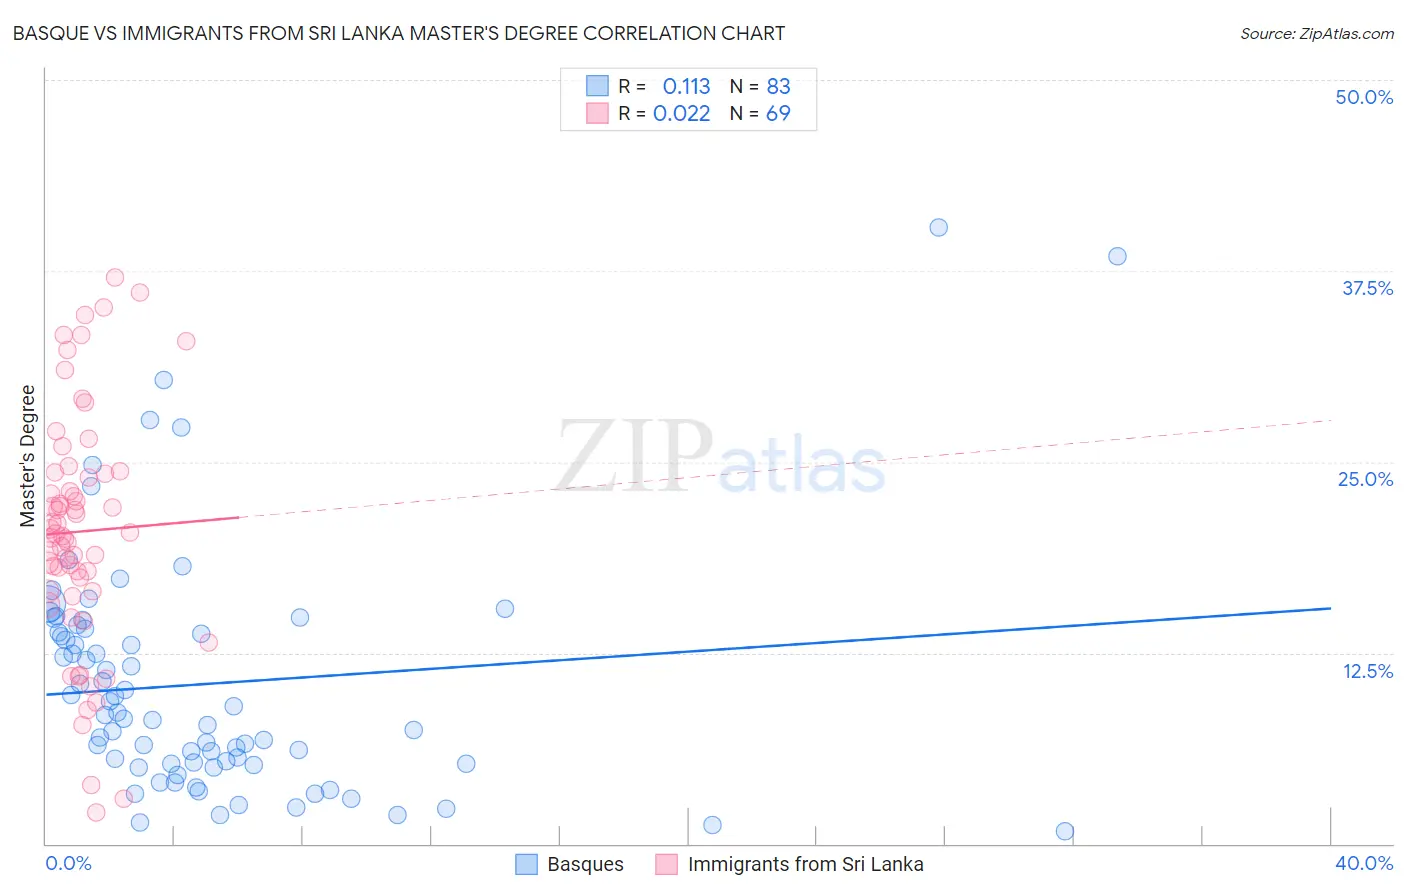
Basque vs Immigrants from Sri Lanka Master's Degree Correlation Chart
The statistical analysis conducted on geographies consisting of 165,765,652 people shows a poor positive correlation between the proportion of Basques and percentage of population with at least master's degree education in the United States with a correlation coefficient (R) of 0.113 and weighted average of 14.7%. Similarly, the statistical analysis conducted on geographies consisting of 149,694,773 people shows no correlation between the proportion of Immigrants from Sri Lanka and percentage of population with at least master's degree education in the United States with a correlation coefficient (R) of 0.022 and weighted average of 19.9%, a difference of 35.8%.
Master's Degree Correlation Summary
| Measurement | Basque | Immigrants from Sri Lanka |
| Minimum | 0.80% | 2.0% |
| Maximum | 40.4% | 37.1% |
| Range | 39.6% | 35.1% |
| Mean | 10.5% | 20.4% |
| Median | 8.4% | 20.3% |
| Interquartile 25% (IQ1) | 5.2% | 16.5% |
| Interquartile 75% (IQ3) | 14.1% | 24.3% |
| Interquartile Range (IQR) | 8.9% | 7.7% |
| Standard Deviation (Sample) | 7.8% | 7.8% |
| Standard Deviation (Population) | 7.8% | 7.7% |
Similar Demographics by Master's Degree
Demographics Similar to Basques by Master's Degree
In terms of master's degree, the demographic groups most similar to Basques are Immigrants from Costa Rica (14.7%, a difference of 0.040%), Immigrants from Oceania (14.7%, a difference of 0.080%), Immigrants (14.6%, a difference of 0.080%), Spaniard (14.6%, a difference of 0.10%), and Barbadian (14.7%, a difference of 0.24%).
| Demographics | Rating | Rank | Master's Degree |
| Celtics | 41.3 /100 | #180 | Average 14.8% |
| Swiss | 41.1 /100 | #181 | Average 14.7% |
| Czechs | 40.4 /100 | #182 | Average 14.7% |
| Sri Lankans | 39.6 /100 | #183 | Fair 14.7% |
| Immigrants | Zaire | 39.5 /100 | #184 | Fair 14.7% |
| Barbadians | 38.3 /100 | #185 | Fair 14.7% |
| Immigrants | Oceania | 37.1 /100 | #186 | Fair 14.7% |
| Basques | 36.5 /100 | #187 | Fair 14.7% |
| Immigrants | Costa Rica | 36.2 /100 | #188 | Fair 14.7% |
| Immigrants | Immigrants | 36.0 /100 | #189 | Fair 14.6% |
| Spaniards | 35.8 /100 | #190 | Fair 14.6% |
| Welsh | 34.2 /100 | #191 | Fair 14.6% |
| Immigrants | Middle Africa | 33.6 /100 | #192 | Fair 14.6% |
| Immigrants | Nigeria | 32.7 /100 | #193 | Fair 14.6% |
| Chinese | 32.5 /100 | #194 | Fair 14.6% |
Demographics Similar to Immigrants from Sri Lanka by Master's Degree
In terms of master's degree, the demographic groups most similar to Immigrants from Sri Lanka are Turkish (19.9%, a difference of 0.070%), Cambodian (20.0%, a difference of 0.41%), Latvian (19.8%, a difference of 0.48%), Immigrants from Japan (20.0%, a difference of 0.51%), and Immigrants from Turkey (19.7%, a difference of 0.99%).
| Demographics | Rating | Rank | Master's Degree |
| Indians (Asian) | 100.0 /100 | #20 | Exceptional 20.5% |
| Immigrants | Ireland | 100.0 /100 | #21 | Exceptional 20.4% |
| Israelis | 100.0 /100 | #22 | Exceptional 20.3% |
| Immigrants | France | 100.0 /100 | #23 | Exceptional 20.3% |
| Immigrants | Sweden | 100.0 /100 | #24 | Exceptional 20.3% |
| Immigrants | Japan | 100.0 /100 | #25 | Exceptional 20.0% |
| Cambodians | 100.0 /100 | #26 | Exceptional 20.0% |
| Immigrants | Sri Lanka | 100.0 /100 | #27 | Exceptional 19.9% |
| Turks | 100.0 /100 | #28 | Exceptional 19.9% |
| Latvians | 100.0 /100 | #29 | Exceptional 19.8% |
| Immigrants | Turkey | 100.0 /100 | #30 | Exceptional 19.7% |
| Immigrants | Korea | 100.0 /100 | #31 | Exceptional 19.7% |
| Burmese | 100.0 /100 | #32 | Exceptional 19.7% |
| Russians | 100.0 /100 | #33 | Exceptional 19.5% |
| Immigrants | Denmark | 100.0 /100 | #34 | Exceptional 19.5% |