Immigrants from South America vs Immigrants from Kuwait Master's Degree
COMPARE
Immigrants from South America
Immigrants from Kuwait
Master's Degree
Master's Degree Comparison
Immigrants from South America
Immigrants from Kuwait
15.5%
MASTER'S DEGREE
76.3/ 100
METRIC RATING
154th/ 347
METRIC RANK
18.6%
MASTER'S DEGREE
100.0/ 100
METRIC RATING
52nd/ 347
METRIC RANK
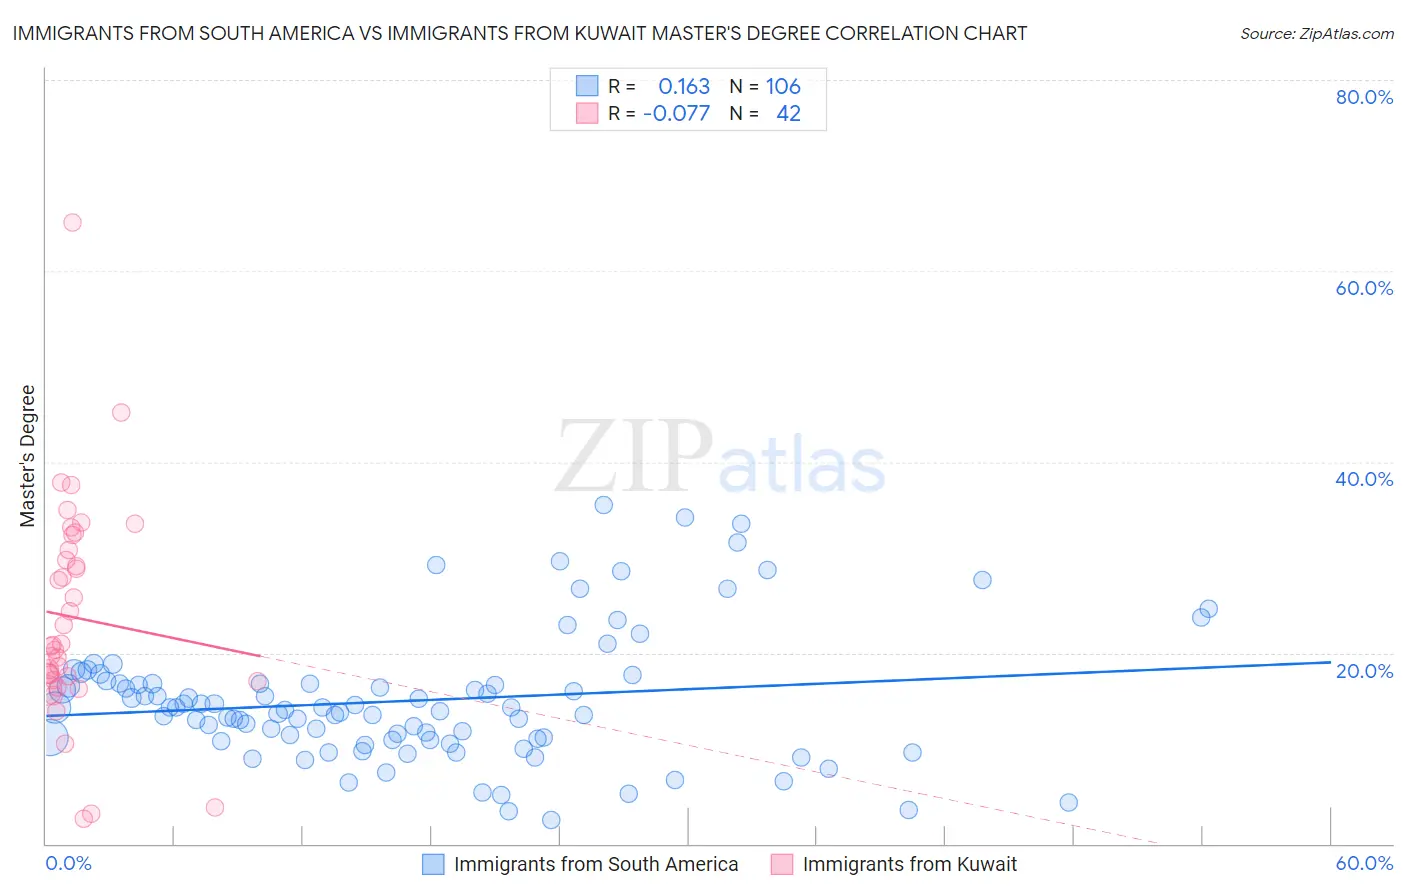
Immigrants from South America vs Immigrants from Kuwait Master's Degree Correlation Chart
The statistical analysis conducted on geographies consisting of 486,157,509 people shows a poor positive correlation between the proportion of Immigrants from South America and percentage of population with at least master's degree education in the United States with a correlation coefficient (R) of 0.163 and weighted average of 15.5%. Similarly, the statistical analysis conducted on geographies consisting of 136,916,630 people shows a slight negative correlation between the proportion of Immigrants from Kuwait and percentage of population with at least master's degree education in the United States with a correlation coefficient (R) of -0.077 and weighted average of 18.6%, a difference of 19.9%.
Master's Degree Correlation Summary
| Measurement | Immigrants from South America | Immigrants from Kuwait |
| Minimum | 2.5% | 2.6% |
| Maximum | 35.5% | 65.1% |
| Range | 33.0% | 62.5% |
| Mean | 15.0% | 23.7% |
| Median | 14.1% | 20.7% |
| Interquartile 25% (IQ1) | 10.9% | 17.1% |
| Interquartile 75% (IQ3) | 16.8% | 30.8% |
| Interquartile Range (IQR) | 5.9% | 13.7% |
| Standard Deviation (Sample) | 6.8% | 11.5% |
| Standard Deviation (Population) | 6.8% | 11.4% |
Similar Demographics by Master's Degree
Demographics Similar to Immigrants from South America by Master's Degree
In terms of master's degree, the demographic groups most similar to Immigrants from South America are Immigrants from Bangladesh (15.5%, a difference of 0.040%), Icelander (15.5%, a difference of 0.090%), Slavic (15.5%, a difference of 0.12%), Iraqi (15.5%, a difference of 0.17%), and Slovene (15.5%, a difference of 0.29%).
| Demographics | Rating | Rank | Master's Degree |
| Hungarians | 79.1 /100 | #147 | Good 15.6% |
| Immigrants | Senegal | 78.2 /100 | #148 | Good 15.5% |
| Ghanaians | 78.2 /100 | #149 | Good 15.5% |
| Slovenes | 78.0 /100 | #150 | Good 15.5% |
| Iraqis | 77.3 /100 | #151 | Good 15.5% |
| Slavs | 77.0 /100 | #152 | Good 15.5% |
| Icelanders | 76.8 /100 | #153 | Good 15.5% |
| Immigrants | South America | 76.3 /100 | #154 | Good 15.5% |
| Immigrants | Bangladesh | 76.1 /100 | #155 | Good 15.5% |
| Bermudans | 73.9 /100 | #156 | Good 15.4% |
| Immigrants | Cameroon | 71.7 /100 | #157 | Good 15.4% |
| Immigrants | Poland | 71.5 /100 | #158 | Good 15.4% |
| Luxembourgers | 71.0 /100 | #159 | Good 15.3% |
| Kenyans | 70.3 /100 | #160 | Good 15.3% |
| Sudanese | 68.7 /100 | #161 | Good 15.3% |
Demographics Similar to Immigrants from Kuwait by Master's Degree
In terms of master's degree, the demographic groups most similar to Immigrants from Kuwait are Immigrants from Czechoslovakia (18.5%, a difference of 0.080%), Immigrants from Lithuania (18.5%, a difference of 0.39%), Immigrants from Serbia (18.5%, a difference of 0.42%), Asian (18.4%, a difference of 0.65%), and Immigrants from Asia (18.4%, a difference of 0.79%).
| Demographics | Rating | Rank | Master's Degree |
| Immigrants | Belarus | 100.0 /100 | #45 | Exceptional 18.9% |
| Immigrants | Norway | 100.0 /100 | #46 | Exceptional 18.8% |
| Immigrants | Austria | 100.0 /100 | #47 | Exceptional 18.8% |
| Paraguayans | 100.0 /100 | #48 | Exceptional 18.8% |
| Estonians | 100.0 /100 | #49 | Exceptional 18.8% |
| Bulgarians | 100.0 /100 | #50 | Exceptional 18.8% |
| Immigrants | South Africa | 100.0 /100 | #51 | Exceptional 18.8% |
| Immigrants | Kuwait | 100.0 /100 | #52 | Exceptional 18.6% |
| Immigrants | Czechoslovakia | 99.9 /100 | #53 | Exceptional 18.5% |
| Immigrants | Lithuania | 99.9 /100 | #54 | Exceptional 18.5% |
| Immigrants | Serbia | 99.9 /100 | #55 | Exceptional 18.5% |
| Asians | 99.9 /100 | #56 | Exceptional 18.4% |
| Immigrants | Asia | 99.9 /100 | #57 | Exceptional 18.4% |
| Australians | 99.9 /100 | #58 | Exceptional 18.4% |
| Immigrants | Bulgaria | 99.9 /100 | #59 | Exceptional 18.3% |