Moroccan vs Immigrants from Kuwait Master's Degree
COMPARE
Moroccan
Immigrants from Kuwait
Master's Degree
Master's Degree Comparison
Moroccans
Immigrants from Kuwait
16.8%
MASTER'S DEGREE
98.0/ 100
METRIC RATING
109th/ 347
METRIC RANK
18.6%
MASTER'S DEGREE
100.0/ 100
METRIC RATING
52nd/ 347
METRIC RANK
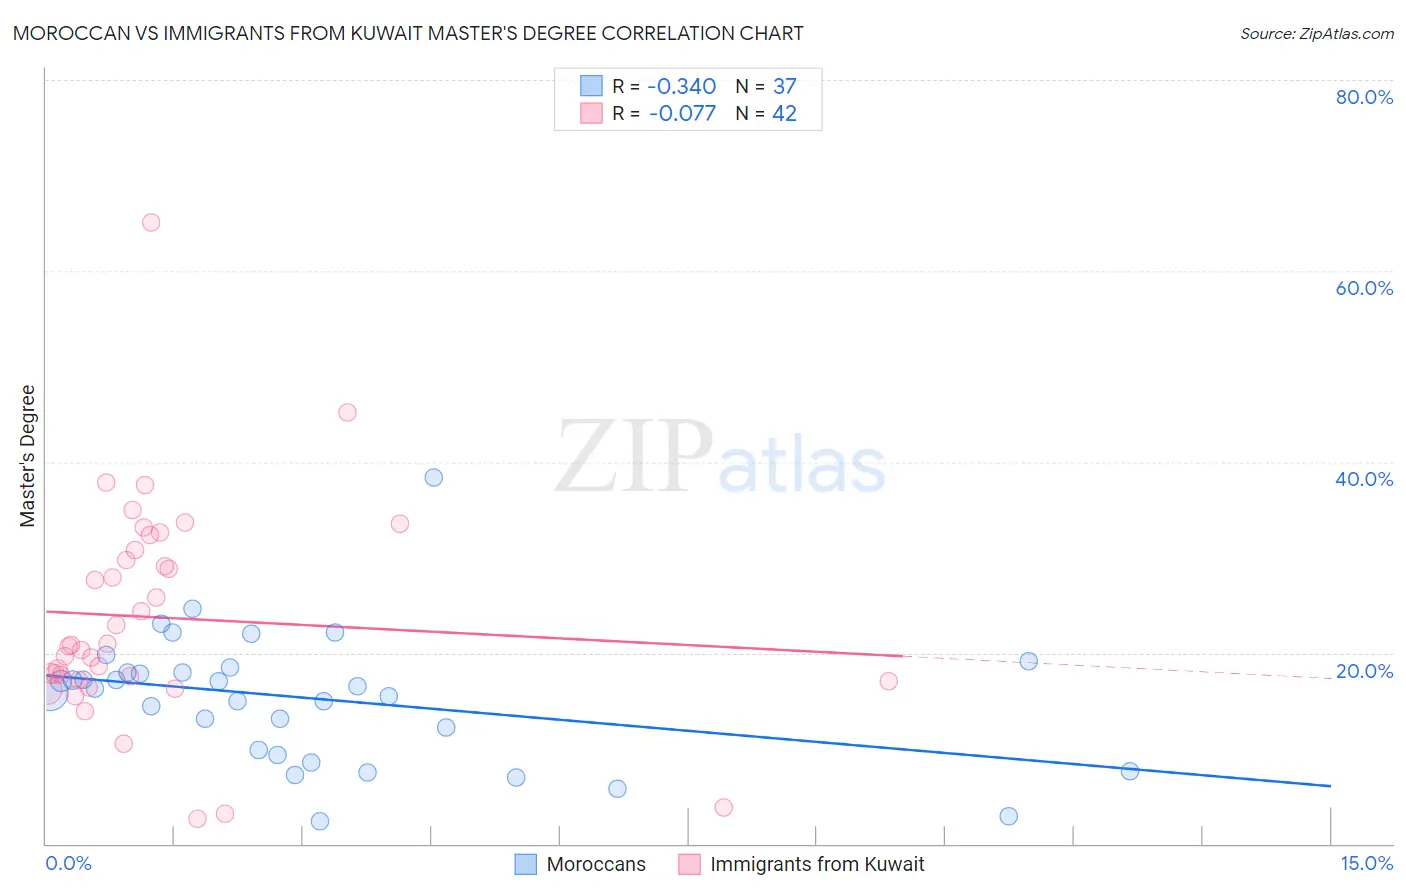
Moroccan vs Immigrants from Kuwait Master's Degree Correlation Chart
The statistical analysis conducted on geographies consisting of 201,797,858 people shows a mild negative correlation between the proportion of Moroccans and percentage of population with at least master's degree education in the United States with a correlation coefficient (R) of -0.340 and weighted average of 16.8%. Similarly, the statistical analysis conducted on geographies consisting of 136,916,630 people shows a slight negative correlation between the proportion of Immigrants from Kuwait and percentage of population with at least master's degree education in the United States with a correlation coefficient (R) of -0.077 and weighted average of 18.6%, a difference of 10.6%.
Master's Degree Correlation Summary
| Measurement | Moroccan | Immigrants from Kuwait |
| Minimum | 2.4% | 2.6% |
| Maximum | 38.4% | 65.1% |
| Range | 36.0% | 62.5% |
| Mean | 15.2% | 23.7% |
| Median | 16.2% | 20.7% |
| Interquartile 25% (IQ1) | 9.6% | 17.1% |
| Interquartile 75% (IQ3) | 18.2% | 30.8% |
| Interquartile Range (IQR) | 8.7% | 13.7% |
| Standard Deviation (Sample) | 6.9% | 11.5% |
| Standard Deviation (Population) | 6.8% | 11.4% |
Similar Demographics by Master's Degree
Demographics Similar to Moroccans by Master's Degree
In terms of master's degree, the demographic groups most similar to Moroccans are Sierra Leonean (16.8%, a difference of 0.020%), Immigrants from Chile (16.8%, a difference of 0.030%), Armenian (16.8%, a difference of 0.050%), Immigrants from Albania (16.8%, a difference of 0.14%), and Austrian (16.7%, a difference of 0.30%).
| Demographics | Rating | Rank | Master's Degree |
| Chileans | 98.6 /100 | #102 | Exceptional 16.9% |
| Alsatians | 98.4 /100 | #103 | Exceptional 16.9% |
| Ukrainians | 98.3 /100 | #104 | Exceptional 16.9% |
| Syrians | 98.3 /100 | #105 | Exceptional 16.8% |
| Immigrants | Albania | 98.1 /100 | #106 | Exceptional 16.8% |
| Armenians | 98.0 /100 | #107 | Exceptional 16.8% |
| Sierra Leoneans | 98.0 /100 | #108 | Exceptional 16.8% |
| Moroccans | 98.0 /100 | #109 | Exceptional 16.8% |
| Immigrants | Chile | 98.0 /100 | #110 | Exceptional 16.8% |
| Austrians | 97.8 /100 | #111 | Exceptional 16.7% |
| Macedonians | 97.7 /100 | #112 | Exceptional 16.7% |
| Arabs | 97.7 /100 | #113 | Exceptional 16.7% |
| Northern Europeans | 97.6 /100 | #114 | Exceptional 16.7% |
| Immigrants | Uganda | 97.3 /100 | #115 | Exceptional 16.6% |
| Immigrants | Southern Europe | 97.2 /100 | #116 | Exceptional 16.6% |
Demographics Similar to Immigrants from Kuwait by Master's Degree
In terms of master's degree, the demographic groups most similar to Immigrants from Kuwait are Immigrants from Czechoslovakia (18.5%, a difference of 0.080%), Immigrants from Lithuania (18.5%, a difference of 0.39%), Immigrants from Serbia (18.5%, a difference of 0.42%), Asian (18.4%, a difference of 0.65%), and Immigrants from Asia (18.4%, a difference of 0.79%).
| Demographics | Rating | Rank | Master's Degree |
| Immigrants | Belarus | 100.0 /100 | #45 | Exceptional 18.9% |
| Immigrants | Norway | 100.0 /100 | #46 | Exceptional 18.8% |
| Immigrants | Austria | 100.0 /100 | #47 | Exceptional 18.8% |
| Paraguayans | 100.0 /100 | #48 | Exceptional 18.8% |
| Estonians | 100.0 /100 | #49 | Exceptional 18.8% |
| Bulgarians | 100.0 /100 | #50 | Exceptional 18.8% |
| Immigrants | South Africa | 100.0 /100 | #51 | Exceptional 18.8% |
| Immigrants | Kuwait | 100.0 /100 | #52 | Exceptional 18.6% |
| Immigrants | Czechoslovakia | 99.9 /100 | #53 | Exceptional 18.5% |
| Immigrants | Lithuania | 99.9 /100 | #54 | Exceptional 18.5% |
| Immigrants | Serbia | 99.9 /100 | #55 | Exceptional 18.5% |
| Asians | 99.9 /100 | #56 | Exceptional 18.4% |
| Immigrants | Asia | 99.9 /100 | #57 | Exceptional 18.4% |
| Australians | 99.9 /100 | #58 | Exceptional 18.4% |
| Immigrants | Bulgaria | 99.9 /100 | #59 | Exceptional 18.3% |