Basque vs Slavic Master's Degree
COMPARE
Basque
Slavic
Master's Degree
Master's Degree Comparison
Basques
Slavs
14.7%
MASTER'S DEGREE
36.5/ 100
METRIC RATING
187th/ 347
METRIC RANK
15.5%
MASTER'S DEGREE
77.0/ 100
METRIC RATING
152nd/ 347
METRIC RANK
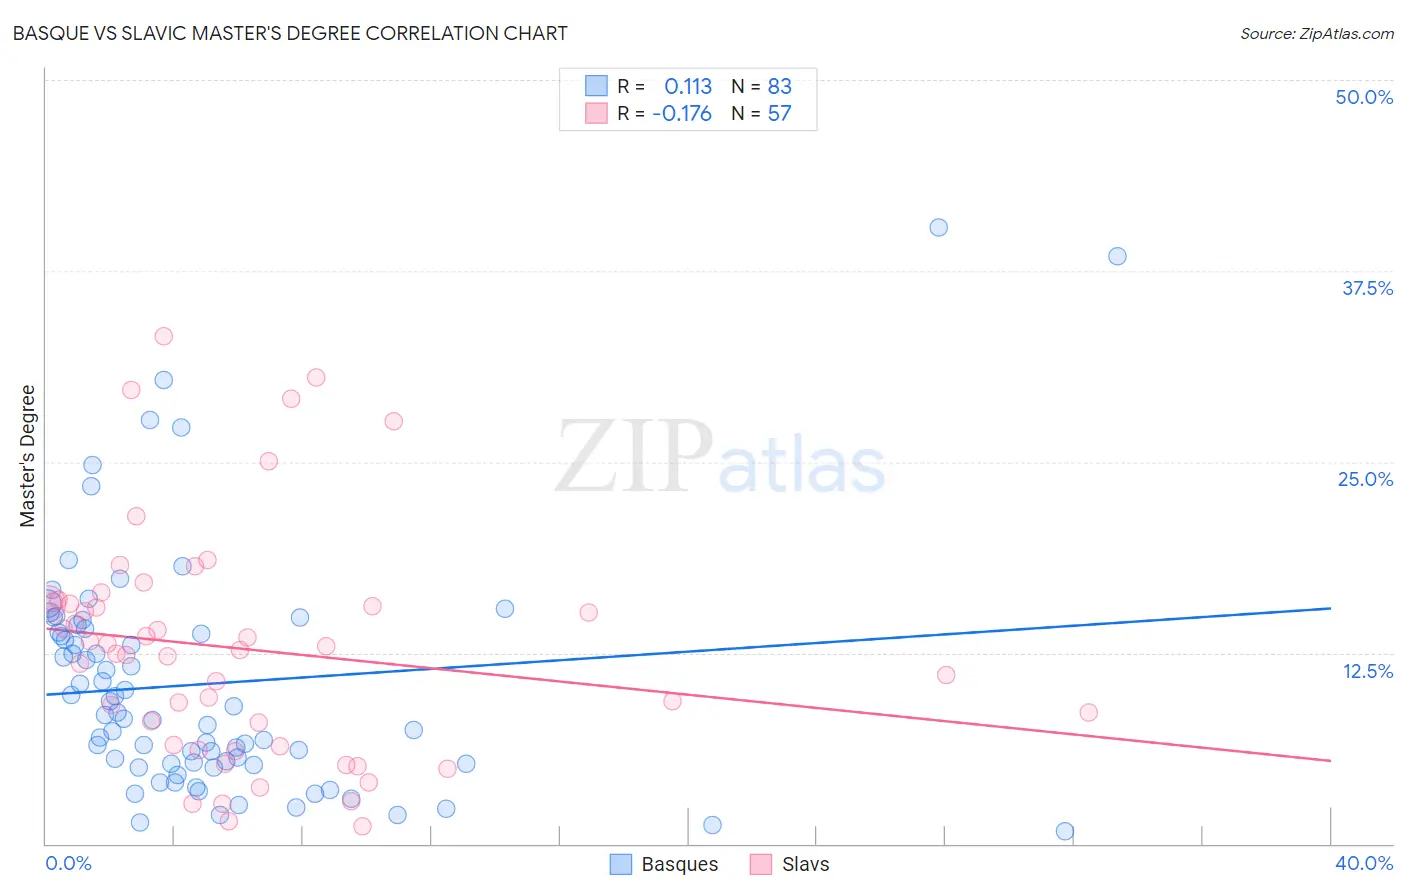
Basque vs Slavic Master's Degree Correlation Chart
The statistical analysis conducted on geographies consisting of 165,765,652 people shows a poor positive correlation between the proportion of Basques and percentage of population with at least master's degree education in the United States with a correlation coefficient (R) of 0.113 and weighted average of 14.7%. Similarly, the statistical analysis conducted on geographies consisting of 270,833,952 people shows a poor negative correlation between the proportion of Slavs and percentage of population with at least master's degree education in the United States with a correlation coefficient (R) of -0.176 and weighted average of 15.5%, a difference of 5.7%.
Master's Degree Correlation Summary
| Measurement | Basque | Slavic |
| Minimum | 0.80% | 1.1% |
| Maximum | 40.4% | 33.2% |
| Range | 39.6% | 32.1% |
| Mean | 10.5% | 12.8% |
| Median | 8.4% | 12.6% |
| Interquartile 25% (IQ1) | 5.2% | 6.4% |
| Interquartile 75% (IQ3) | 14.1% | 15.7% |
| Interquartile Range (IQR) | 8.9% | 9.3% |
| Standard Deviation (Sample) | 7.8% | 7.5% |
| Standard Deviation (Population) | 7.8% | 7.5% |
Similar Demographics by Master's Degree
Demographics Similar to Basques by Master's Degree
In terms of master's degree, the demographic groups most similar to Basques are Immigrants from Costa Rica (14.7%, a difference of 0.040%), Immigrants from Oceania (14.7%, a difference of 0.080%), Immigrants (14.6%, a difference of 0.080%), Spaniard (14.6%, a difference of 0.10%), and Barbadian (14.7%, a difference of 0.24%).
| Demographics | Rating | Rank | Master's Degree |
| Celtics | 41.3 /100 | #180 | Average 14.8% |
| Swiss | 41.1 /100 | #181 | Average 14.7% |
| Czechs | 40.4 /100 | #182 | Average 14.7% |
| Sri Lankans | 39.6 /100 | #183 | Fair 14.7% |
| Immigrants | Zaire | 39.5 /100 | #184 | Fair 14.7% |
| Barbadians | 38.3 /100 | #185 | Fair 14.7% |
| Immigrants | Oceania | 37.1 /100 | #186 | Fair 14.7% |
| Basques | 36.5 /100 | #187 | Fair 14.7% |
| Immigrants | Costa Rica | 36.2 /100 | #188 | Fair 14.7% |
| Immigrants | Immigrants | 36.0 /100 | #189 | Fair 14.6% |
| Spaniards | 35.8 /100 | #190 | Fair 14.6% |
| Welsh | 34.2 /100 | #191 | Fair 14.6% |
| Immigrants | Middle Africa | 33.6 /100 | #192 | Fair 14.6% |
| Immigrants | Nigeria | 32.7 /100 | #193 | Fair 14.6% |
| Chinese | 32.5 /100 | #194 | Fair 14.6% |
Demographics Similar to Slavs by Master's Degree
In terms of master's degree, the demographic groups most similar to Slavs are Icelander (15.5%, a difference of 0.030%), Iraqi (15.5%, a difference of 0.050%), Immigrants from South America (15.5%, a difference of 0.12%), Immigrants from Bangladesh (15.5%, a difference of 0.16%), and Slovene (15.5%, a difference of 0.17%).
| Demographics | Rating | Rank | Master's Degree |
| South Americans | 81.3 /100 | #145 | Excellent 15.6% |
| Immigrants | Afghanistan | 79.4 /100 | #146 | Good 15.6% |
| Hungarians | 79.1 /100 | #147 | Good 15.6% |
| Immigrants | Senegal | 78.2 /100 | #148 | Good 15.5% |
| Ghanaians | 78.2 /100 | #149 | Good 15.5% |
| Slovenes | 78.0 /100 | #150 | Good 15.5% |
| Iraqis | 77.3 /100 | #151 | Good 15.5% |
| Slavs | 77.0 /100 | #152 | Good 15.5% |
| Icelanders | 76.8 /100 | #153 | Good 15.5% |
| Immigrants | South America | 76.3 /100 | #154 | Good 15.5% |
| Immigrants | Bangladesh | 76.1 /100 | #155 | Good 15.5% |
| Bermudans | 73.9 /100 | #156 | Good 15.4% |
| Immigrants | Cameroon | 71.7 /100 | #157 | Good 15.4% |
| Immigrants | Poland | 71.5 /100 | #158 | Good 15.4% |
| Luxembourgers | 71.0 /100 | #159 | Good 15.3% |