Basque vs Immigrants from Kuwait Householder Income Under 25 years
COMPARE
Basque
Immigrants from Kuwait
Householder Income Under 25 years
Householder Income Under 25 years Comparison
Basques
Immigrants from Kuwait
$51,818
HOUSEHOLDER INCOME UNDER 25 YEARS
28.7/ 100
METRIC RATING
179th/ 347
METRIC RANK
$48,126
HOUSEHOLDER INCOME UNDER 25 YEARS
0.0/ 100
METRIC RATING
301st/ 347
METRIC RANK
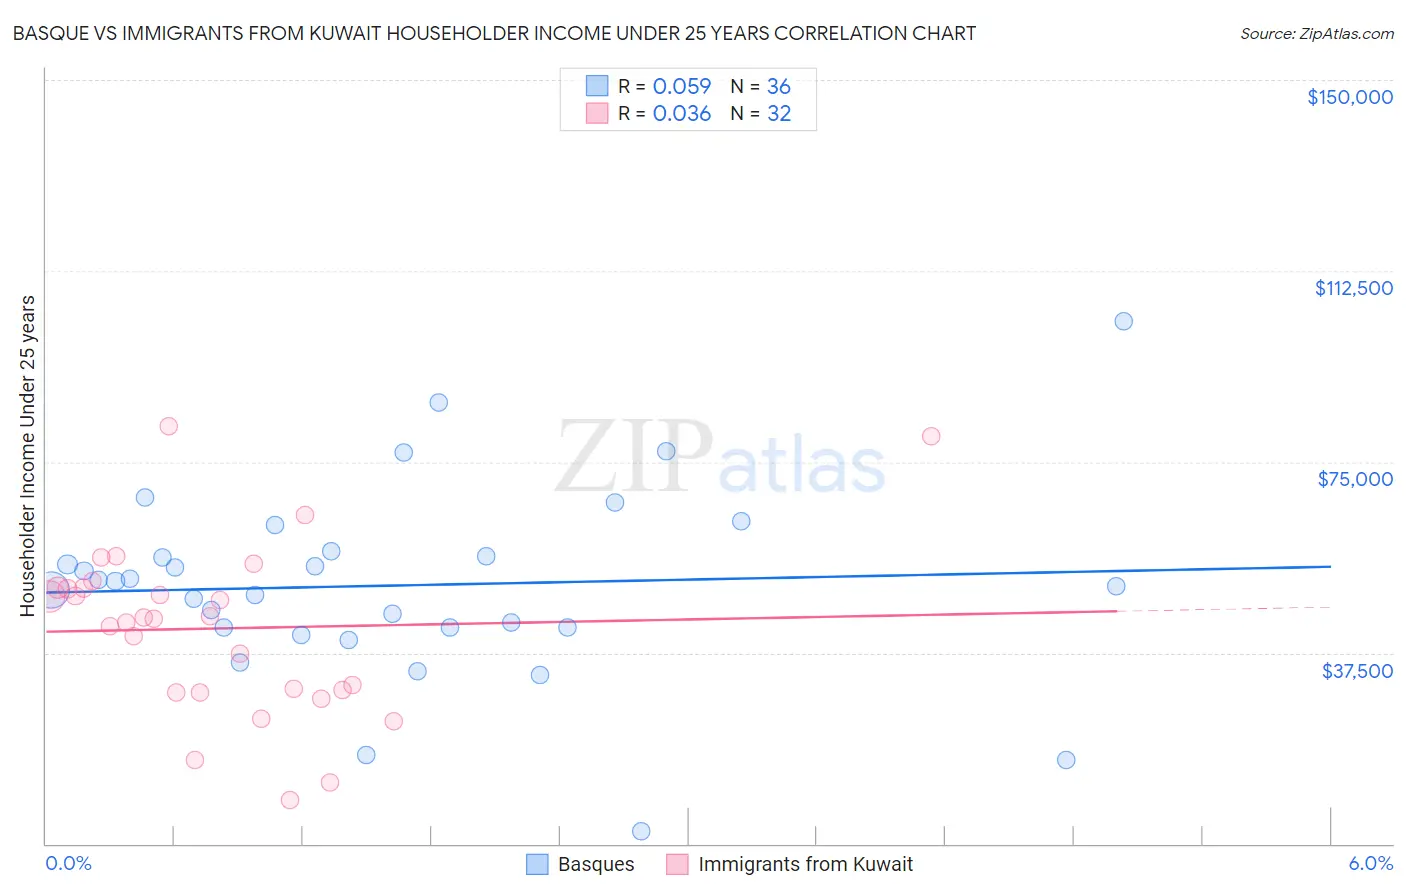
Basque vs Immigrants from Kuwait Householder Income Under 25 years Correlation Chart
The statistical analysis conducted on geographies consisting of 150,470,648 people shows a slight positive correlation between the proportion of Basques and household income with householder under the age of 25 in the United States with a correlation coefficient (R) of 0.059 and weighted average of $51,818. Similarly, the statistical analysis conducted on geographies consisting of 126,358,958 people shows no correlation between the proportion of Immigrants from Kuwait and household income with householder under the age of 25 in the United States with a correlation coefficient (R) of 0.036 and weighted average of $48,126, a difference of 7.7%.
Householder Income Under 25 years Correlation Summary
| Measurement | Basque | Immigrants from Kuwait |
| Minimum | $2,499 | $8,680 |
| Maximum | $102,571 | $81,978 |
| Range | $100,072 | $73,298 |
| Mean | $50,731 | $42,291 |
| Median | $51,007 | $44,394 |
| Interquartile 25% (IQ1) | $42,540 | $29,899 |
| Interquartile 75% (IQ3) | $57,010 | $50,227 |
| Interquartile Range (IQR) | $14,470 | $20,328 |
| Standard Deviation (Sample) | $18,783 | $16,858 |
| Standard Deviation (Population) | $18,521 | $16,592 |
Similar Demographics by Householder Income Under 25 years
Demographics Similar to Basques by Householder Income Under 25 years
In terms of householder income under 25 years, the demographic groups most similar to Basques are Immigrants from England ($51,817, a difference of 0.0%), Finnish ($51,827, a difference of 0.020%), European ($51,796, a difference of 0.040%), Jordanian ($51,796, a difference of 0.040%), and British West Indian ($51,844, a difference of 0.050%).
| Demographics | Rating | Rank | Householder Income Under 25 years |
| Cypriots | 51.2 /100 | #172 | Average $52,209 |
| Barbadians | 50.8 /100 | #173 | Average $52,202 |
| Immigrants | Western Asia | 50.0 /100 | #174 | Average $52,190 |
| Immigrants | Zimbabwe | 33.8 /100 | #175 | Fair $51,914 |
| Austrians | 32.9 /100 | #176 | Fair $51,898 |
| British West Indians | 30.0 /100 | #177 | Fair $51,844 |
| Finns | 29.2 /100 | #178 | Fair $51,827 |
| Basques | 28.7 /100 | #179 | Fair $51,818 |
| Immigrants | England | 28.7 /100 | #180 | Fair $51,817 |
| Europeans | 27.6 /100 | #181 | Fair $51,796 |
| Jordanians | 27.6 /100 | #182 | Fair $51,796 |
| Mexican American Indians | 27.0 /100 | #183 | Fair $51,783 |
| Paiute | 25.1 /100 | #184 | Fair $51,743 |
| Immigrants | Latvia | 24.8 /100 | #185 | Fair $51,737 |
| Alaskan Athabascans | 23.8 /100 | #186 | Fair $51,713 |
Demographics Similar to Immigrants from Kuwait by Householder Income Under 25 years
In terms of householder income under 25 years, the demographic groups most similar to Immigrants from Kuwait are Immigrants from Somalia ($48,135, a difference of 0.020%), Immigrants from Honduras ($48,267, a difference of 0.29%), Immigrants from Liberia ($47,981, a difference of 0.30%), Yaqui ($48,300, a difference of 0.36%), and Immigrants from Middle Africa ($47,916, a difference of 0.44%).
| Demographics | Rating | Rank | Householder Income Under 25 years |
| Somalis | 0.0 /100 | #294 | Tragic $48,657 |
| Central American Indians | 0.0 /100 | #295 | Tragic $48,643 |
| Blackfeet | 0.0 /100 | #296 | Tragic $48,603 |
| Cree | 0.0 /100 | #297 | Tragic $48,514 |
| Yaqui | 0.0 /100 | #298 | Tragic $48,300 |
| Immigrants | Honduras | 0.0 /100 | #299 | Tragic $48,267 |
| Immigrants | Somalia | 0.0 /100 | #300 | Tragic $48,135 |
| Immigrants | Kuwait | 0.0 /100 | #301 | Tragic $48,126 |
| Immigrants | Liberia | 0.0 /100 | #302 | Tragic $47,981 |
| Immigrants | Middle Africa | 0.0 /100 | #303 | Tragic $47,916 |
| Menominee | 0.0 /100 | #304 | Tragic $47,907 |
| Cherokee | 0.0 /100 | #305 | Tragic $47,848 |
| Natives/Alaskans | 0.0 /100 | #306 | Tragic $47,704 |
| Bangladeshis | 0.0 /100 | #307 | Tragic $47,589 |
| Comanche | 0.0 /100 | #308 | Tragic $47,518 |