Basque vs Immigrants from Vietnam Master's Degree
COMPARE
Basque
Immigrants from Vietnam
Master's Degree
Master's Degree Comparison
Basques
Immigrants from Vietnam
14.7%
MASTER'S DEGREE
36.5/ 100
METRIC RATING
187th/ 347
METRIC RANK
14.1%
MASTER'S DEGREE
16.1/ 100
METRIC RATING
215th/ 347
METRIC RANK
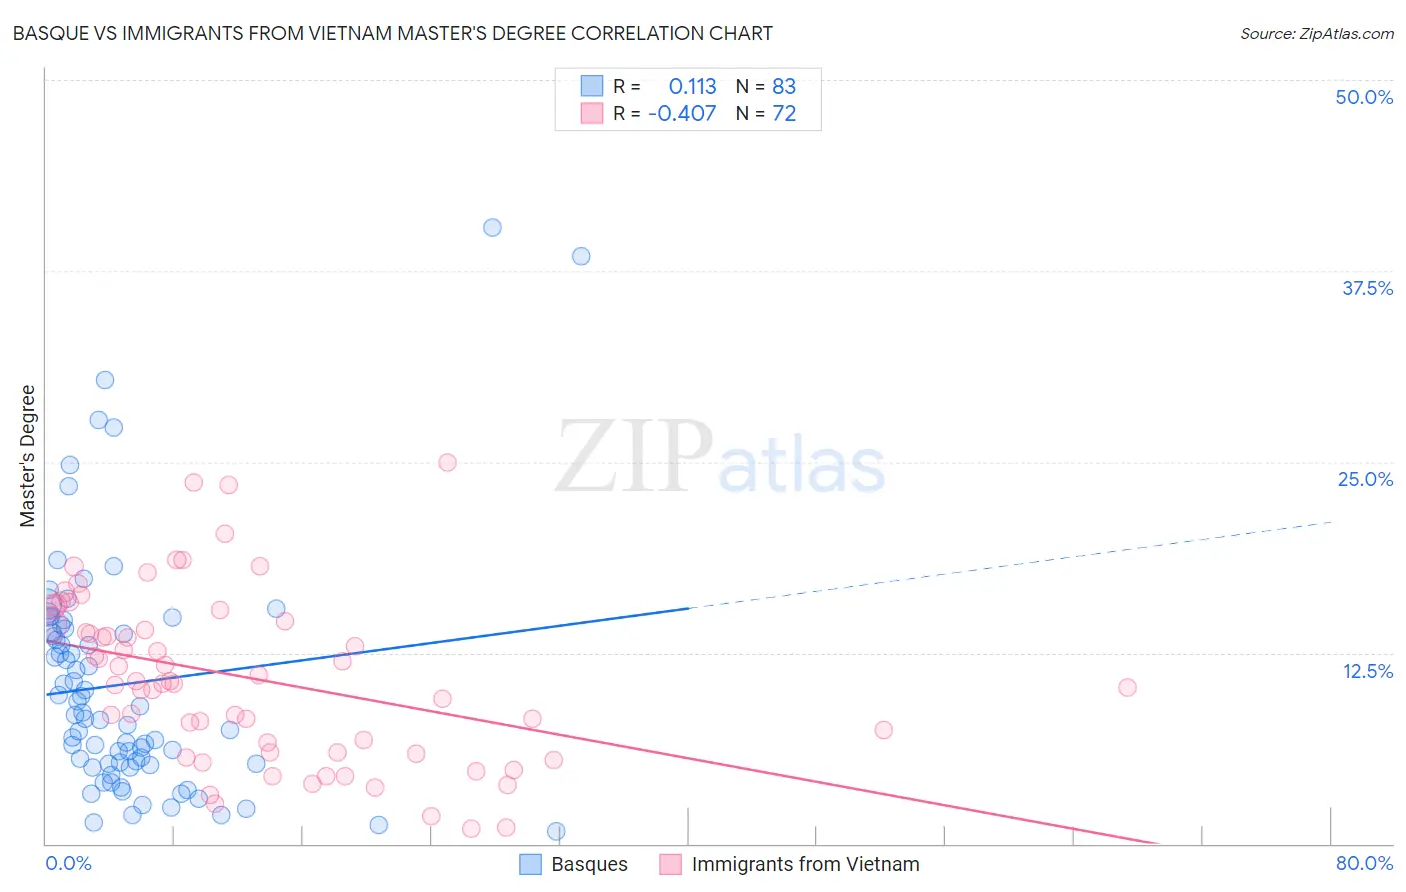
Basque vs Immigrants from Vietnam Master's Degree Correlation Chart
The statistical analysis conducted on geographies consisting of 165,765,652 people shows a poor positive correlation between the proportion of Basques and percentage of population with at least master's degree education in the United States with a correlation coefficient (R) of 0.113 and weighted average of 14.7%. Similarly, the statistical analysis conducted on geographies consisting of 404,720,080 people shows a moderate negative correlation between the proportion of Immigrants from Vietnam and percentage of population with at least master's degree education in the United States with a correlation coefficient (R) of -0.407 and weighted average of 14.1%, a difference of 3.7%.
Master's Degree Correlation Summary
| Measurement | Basque | Immigrants from Vietnam |
| Minimum | 0.80% | 0.99% |
| Maximum | 40.4% | 25.0% |
| Range | 39.6% | 24.0% |
| Mean | 10.5% | 10.8% |
| Median | 8.4% | 10.5% |
| Interquartile 25% (IQ1) | 5.2% | 6.0% |
| Interquartile 75% (IQ3) | 14.1% | 14.4% |
| Interquartile Range (IQR) | 8.9% | 8.5% |
| Standard Deviation (Sample) | 7.8% | 5.6% |
| Standard Deviation (Population) | 7.8% | 5.5% |
Similar Demographics by Master's Degree
Demographics Similar to Basques by Master's Degree
In terms of master's degree, the demographic groups most similar to Basques are Immigrants from Costa Rica (14.7%, a difference of 0.040%), Immigrants from Oceania (14.7%, a difference of 0.080%), Immigrants (14.6%, a difference of 0.080%), Spaniard (14.6%, a difference of 0.10%), and Barbadian (14.7%, a difference of 0.24%).
| Demographics | Rating | Rank | Master's Degree |
| Celtics | 41.3 /100 | #180 | Average 14.8% |
| Swiss | 41.1 /100 | #181 | Average 14.7% |
| Czechs | 40.4 /100 | #182 | Average 14.7% |
| Sri Lankans | 39.6 /100 | #183 | Fair 14.7% |
| Immigrants | Zaire | 39.5 /100 | #184 | Fair 14.7% |
| Barbadians | 38.3 /100 | #185 | Fair 14.7% |
| Immigrants | Oceania | 37.1 /100 | #186 | Fair 14.7% |
| Basques | 36.5 /100 | #187 | Fair 14.7% |
| Immigrants | Costa Rica | 36.2 /100 | #188 | Fair 14.7% |
| Immigrants | Immigrants | 36.0 /100 | #189 | Fair 14.6% |
| Spaniards | 35.8 /100 | #190 | Fair 14.6% |
| Welsh | 34.2 /100 | #191 | Fair 14.6% |
| Immigrants | Middle Africa | 33.6 /100 | #192 | Fair 14.6% |
| Immigrants | Nigeria | 32.7 /100 | #193 | Fair 14.6% |
| Chinese | 32.5 /100 | #194 | Fair 14.6% |
Demographics Similar to Immigrants from Vietnam by Master's Degree
In terms of master's degree, the demographic groups most similar to Immigrants from Vietnam are Immigrants from Somalia (14.1%, a difference of 0.070%), Immigrants from Trinidad and Tobago (14.1%, a difference of 0.070%), Finnish (14.2%, a difference of 0.21%), Immigrants from Thailand (14.2%, a difference of 0.22%), and French Canadian (14.1%, a difference of 0.32%).
| Demographics | Rating | Rank | Master's Degree |
| Immigrants | Barbados | 20.5 /100 | #208 | Fair 14.3% |
| Immigrants | Panama | 20.0 /100 | #209 | Fair 14.3% |
| Sub-Saharan Africans | 19.4 /100 | #210 | Poor 14.2% |
| Somalis | 18.0 /100 | #211 | Poor 14.2% |
| Spanish | 17.8 /100 | #212 | Poor 14.2% |
| Immigrants | Thailand | 17.0 /100 | #213 | Poor 14.2% |
| Finns | 16.9 /100 | #214 | Poor 14.2% |
| Immigrants | Vietnam | 16.1 /100 | #215 | Poor 14.1% |
| Immigrants | Somalia | 15.8 /100 | #216 | Poor 14.1% |
| Immigrants | Trinidad and Tobago | 15.8 /100 | #217 | Poor 14.1% |
| French Canadians | 14.9 /100 | #218 | Poor 14.1% |
| Norwegians | 13.6 /100 | #219 | Poor 14.0% |
| Germans | 13.1 /100 | #220 | Poor 14.0% |
| Koreans | 12.7 /100 | #221 | Poor 14.0% |
| Ecuadorians | 12.6 /100 | #222 | Poor 14.0% |