Basque vs Chickasaw Master's Degree
COMPARE
Basque
Chickasaw
Master's Degree
Master's Degree Comparison
Basques
Chickasaw
14.7%
MASTER'S DEGREE
36.5/ 100
METRIC RATING
187th/ 347
METRIC RANK
11.4%
MASTER'S DEGREE
0.1/ 100
METRIC RATING
299th/ 347
METRIC RANK
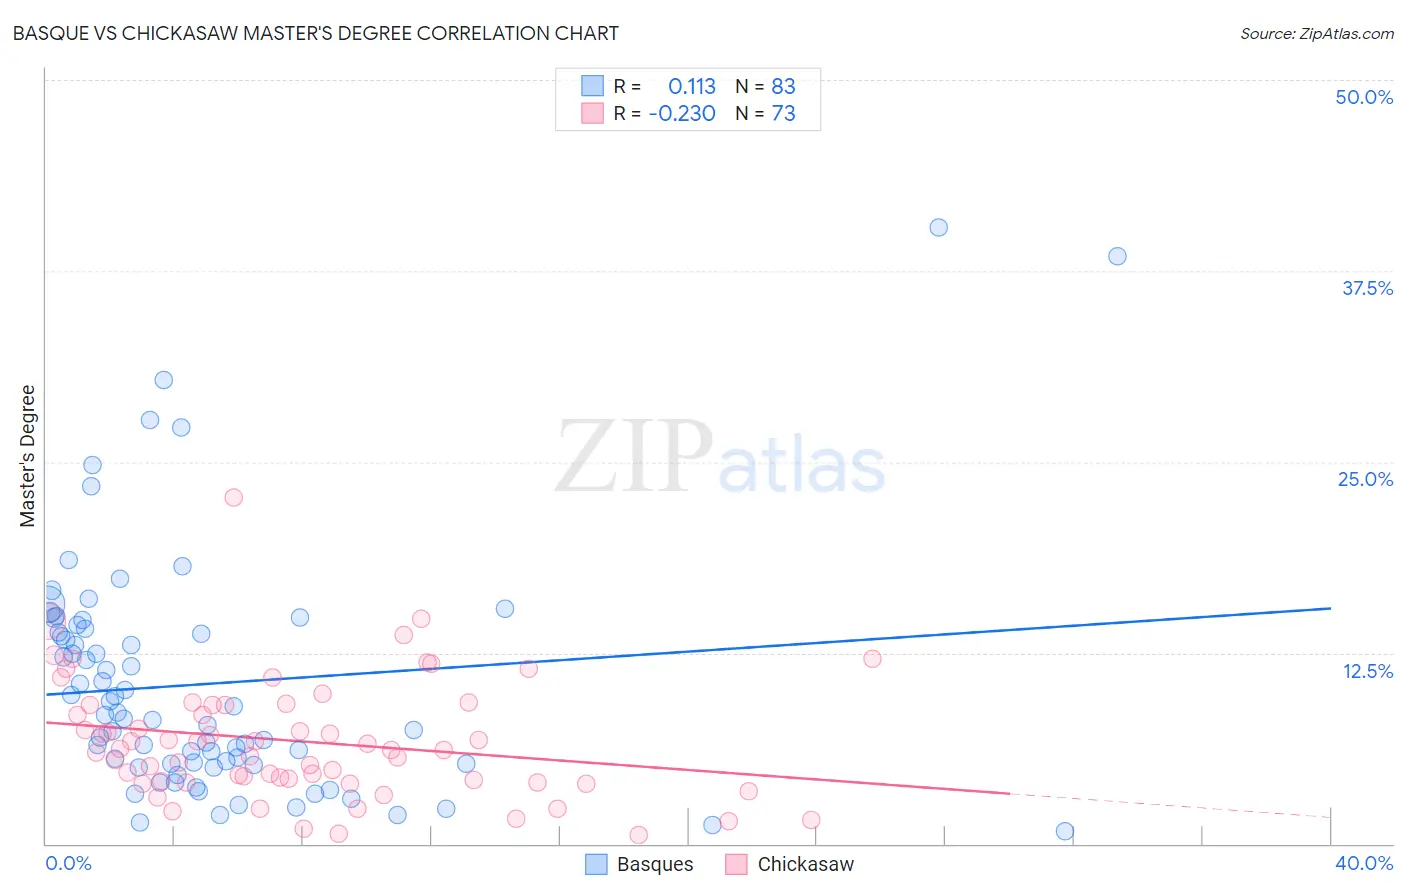
Basque vs Chickasaw Master's Degree Correlation Chart
The statistical analysis conducted on geographies consisting of 165,765,652 people shows a poor positive correlation between the proportion of Basques and percentage of population with at least master's degree education in the United States with a correlation coefficient (R) of 0.113 and weighted average of 14.7%. Similarly, the statistical analysis conducted on geographies consisting of 147,685,526 people shows a weak negative correlation between the proportion of Chickasaw and percentage of population with at least master's degree education in the United States with a correlation coefficient (R) of -0.230 and weighted average of 11.4%, a difference of 28.3%.
Master's Degree Correlation Summary
| Measurement | Basque | Chickasaw |
| Minimum | 0.80% | 0.60% |
| Maximum | 40.4% | 22.7% |
| Range | 39.6% | 22.1% |
| Mean | 10.5% | 6.7% |
| Median | 8.4% | 6.1% |
| Interquartile 25% (IQ1) | 5.2% | 4.1% |
| Interquartile 75% (IQ3) | 14.1% | 9.1% |
| Interquartile Range (IQR) | 8.9% | 5.1% |
| Standard Deviation (Sample) | 7.8% | 3.9% |
| Standard Deviation (Population) | 7.8% | 3.9% |
Similar Demographics by Master's Degree
Demographics Similar to Basques by Master's Degree
In terms of master's degree, the demographic groups most similar to Basques are Immigrants from Costa Rica (14.7%, a difference of 0.040%), Immigrants from Oceania (14.7%, a difference of 0.080%), Immigrants (14.6%, a difference of 0.080%), Spaniard (14.6%, a difference of 0.10%), and Barbadian (14.7%, a difference of 0.24%).
| Demographics | Rating | Rank | Master's Degree |
| Celtics | 41.3 /100 | #180 | Average 14.8% |
| Swiss | 41.1 /100 | #181 | Average 14.7% |
| Czechs | 40.4 /100 | #182 | Average 14.7% |
| Sri Lankans | 39.6 /100 | #183 | Fair 14.7% |
| Immigrants | Zaire | 39.5 /100 | #184 | Fair 14.7% |
| Barbadians | 38.3 /100 | #185 | Fair 14.7% |
| Immigrants | Oceania | 37.1 /100 | #186 | Fair 14.7% |
| Basques | 36.5 /100 | #187 | Fair 14.7% |
| Immigrants | Costa Rica | 36.2 /100 | #188 | Fair 14.7% |
| Immigrants | Immigrants | 36.0 /100 | #189 | Fair 14.6% |
| Spaniards | 35.8 /100 | #190 | Fair 14.6% |
| Welsh | 34.2 /100 | #191 | Fair 14.6% |
| Immigrants | Middle Africa | 33.6 /100 | #192 | Fair 14.6% |
| Immigrants | Nigeria | 32.7 /100 | #193 | Fair 14.6% |
| Chinese | 32.5 /100 | #194 | Fair 14.6% |
Demographics Similar to Chickasaw by Master's Degree
In terms of master's degree, the demographic groups most similar to Chickasaw are Chippewa (11.4%, a difference of 0.020%), Tsimshian (11.4%, a difference of 0.18%), Samoan (11.5%, a difference of 0.46%), Cherokee (11.4%, a difference of 0.49%), and Immigrants from Laos (11.4%, a difference of 0.51%).
| Demographics | Rating | Rank | Master's Degree |
| Immigrants | Guatemala | 0.1 /100 | #292 | Tragic 11.6% |
| Alaska Natives | 0.1 /100 | #293 | Tragic 11.6% |
| Hawaiians | 0.1 /100 | #294 | Tragic 11.6% |
| Marshallese | 0.1 /100 | #295 | Tragic 11.6% |
| Alaskan Athabascans | 0.1 /100 | #296 | Tragic 11.6% |
| Immigrants | Yemen | 0.1 /100 | #297 | Tragic 11.6% |
| Samoans | 0.1 /100 | #298 | Tragic 11.5% |
| Chickasaw | 0.1 /100 | #299 | Tragic 11.4% |
| Chippewa | 0.1 /100 | #300 | Tragic 11.4% |
| Tsimshian | 0.1 /100 | #301 | Tragic 11.4% |
| Cherokee | 0.1 /100 | #302 | Tragic 11.4% |
| Immigrants | Laos | 0.1 /100 | #303 | Tragic 11.4% |
| Immigrants | Cabo Verde | 0.1 /100 | #304 | Tragic 11.3% |
| Immigrants | Latin America | 0.0 /100 | #305 | Tragic 11.3% |
| Mexican American Indians | 0.0 /100 | #306 | Tragic 11.2% |