Apache vs Immigrants from Eastern Europe Bachelor's Degree
COMPARE
Apache
Immigrants from Eastern Europe
Bachelor's Degree
Bachelor's Degree Comparison
Apache
Immigrants from Eastern Europe
28.3%
BACHELOR'S DEGREE
0.0/ 100
METRIC RATING
326th/ 347
METRIC RANK
42.5%
BACHELOR'S DEGREE
99.4/ 100
METRIC RATING
77th/ 347
METRIC RANK
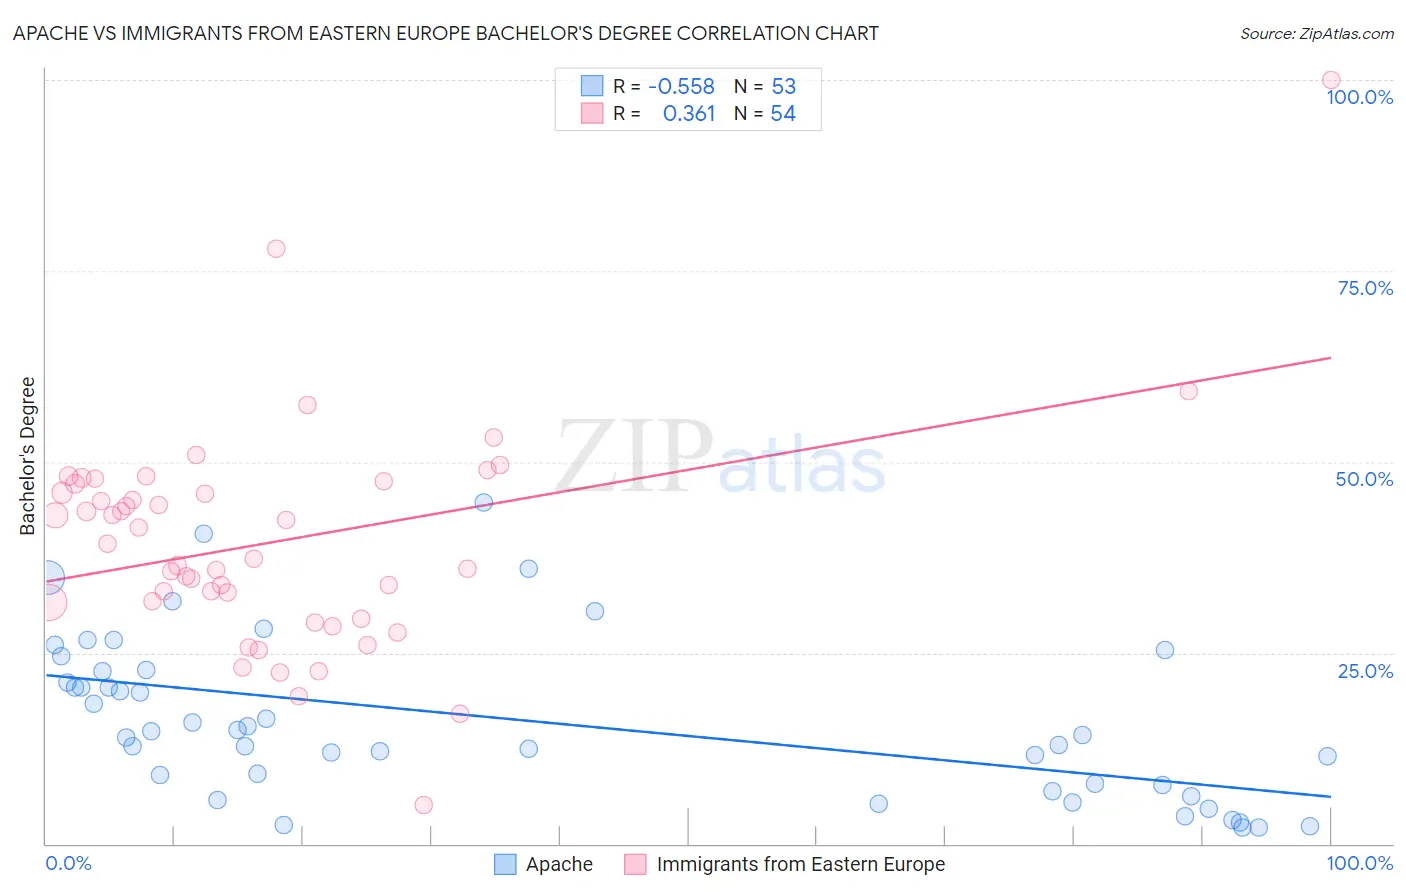
Apache vs Immigrants from Eastern Europe Bachelor's Degree Correlation Chart
The statistical analysis conducted on geographies consisting of 231,132,422 people shows a substantial negative correlation between the proportion of Apache and percentage of population with at least bachelor's degree education in the United States with a correlation coefficient (R) of -0.558 and weighted average of 28.3%. Similarly, the statistical analysis conducted on geographies consisting of 475,819,217 people shows a mild positive correlation between the proportion of Immigrants from Eastern Europe and percentage of population with at least bachelor's degree education in the United States with a correlation coefficient (R) of 0.361 and weighted average of 42.5%, a difference of 50.3%.
Bachelor's Degree Correlation Summary
| Measurement | Apache | Immigrants from Eastern Europe |
| Minimum | 2.1% | 5.0% |
| Maximum | 44.7% | 100.0% |
| Range | 42.5% | 95.0% |
| Mean | 16.1% | 39.5% |
| Median | 14.3% | 38.3% |
| Interquartile 25% (IQ1) | 7.3% | 31.6% |
| Interquartile 75% (IQ3) | 22.7% | 47.1% |
| Interquartile Range (IQR) | 15.4% | 15.5% |
| Standard Deviation (Sample) | 10.5% | 14.7% |
| Standard Deviation (Population) | 10.4% | 14.5% |
Similar Demographics by Bachelor's Degree
Demographics Similar to Apache by Bachelor's Degree
In terms of bachelor's degree, the demographic groups most similar to Apache are Pennsylvania German (28.4%, a difference of 0.39%), Paiute (28.1%, a difference of 0.67%), Dutch West Indian (28.5%, a difference of 0.84%), Fijian (28.7%, a difference of 1.6%), and Tsimshian (28.8%, a difference of 1.7%).
| Demographics | Rating | Rank | Bachelor's Degree |
| Creek | 0.0 /100 | #319 | Tragic 28.9% |
| Kiowa | 0.0 /100 | #320 | Tragic 28.8% |
| Alaskan Athabascans | 0.0 /100 | #321 | Tragic 28.8% |
| Tsimshian | 0.0 /100 | #322 | Tragic 28.8% |
| Fijians | 0.0 /100 | #323 | Tragic 28.7% |
| Dutch West Indians | 0.0 /100 | #324 | Tragic 28.5% |
| Pennsylvania Germans | 0.0 /100 | #325 | Tragic 28.4% |
| Apache | 0.0 /100 | #326 | Tragic 28.3% |
| Paiute | 0.0 /100 | #327 | Tragic 28.1% |
| Crow | 0.0 /100 | #328 | Tragic 27.7% |
| Immigrants | Central America | 0.0 /100 | #329 | Tragic 27.5% |
| Spanish American Indians | 0.0 /100 | #330 | Tragic 27.5% |
| Immigrants | Azores | 0.0 /100 | #331 | Tragic 27.3% |
| Menominee | 0.0 /100 | #332 | Tragic 27.3% |
| Mexicans | 0.0 /100 | #333 | Tragic 27.1% |
Demographics Similar to Immigrants from Eastern Europe by Bachelor's Degree
In terms of bachelor's degree, the demographic groups most similar to Immigrants from Eastern Europe are Immigrants from Ethiopia (42.5%, a difference of 0.060%), Immigrants from Egypt (42.6%, a difference of 0.18%), Immigrants from Zimbabwe (42.6%, a difference of 0.20%), Immigrants from Lebanon (42.4%, a difference of 0.23%), and Bhutanese (42.7%, a difference of 0.41%).
| Demographics | Rating | Rank | Bachelor's Degree |
| Immigrants | Romania | 99.6 /100 | #70 | Exceptional 42.9% |
| Immigrants | Argentina | 99.6 /100 | #71 | Exceptional 42.8% |
| Ethiopians | 99.5 /100 | #72 | Exceptional 42.8% |
| Immigrants | Uzbekistan | 99.5 /100 | #73 | Exceptional 42.8% |
| Bhutanese | 99.5 /100 | #74 | Exceptional 42.7% |
| Immigrants | Zimbabwe | 99.4 /100 | #75 | Exceptional 42.6% |
| Immigrants | Egypt | 99.4 /100 | #76 | Exceptional 42.6% |
| Immigrants | Eastern Europe | 99.4 /100 | #77 | Exceptional 42.5% |
| Immigrants | Ethiopia | 99.4 /100 | #78 | Exceptional 42.5% |
| Immigrants | Lebanon | 99.3 /100 | #79 | Exceptional 42.4% |
| Immigrants | Croatia | 99.2 /100 | #80 | Exceptional 42.3% |
| Immigrants | Hungary | 99.2 /100 | #81 | Exceptional 42.3% |
| Immigrants | Scotland | 99.2 /100 | #82 | Exceptional 42.3% |
| Armenians | 99.2 /100 | #83 | Exceptional 42.3% |
| Immigrants | Western Asia | 99.2 /100 | #84 | Exceptional 42.3% |