Basque vs Immigrants from Afghanistan 11th Grade
COMPARE
Basque
Immigrants from Afghanistan
11th Grade
11th Grade Comparison
Basques
Immigrants from Afghanistan
93.2%
11TH GRADE
95.2/ 100
METRIC RATING
126th/ 347
METRIC RANK
91.8%
11TH GRADE
3.9/ 100
METRIC RATING
230th/ 347
METRIC RANK
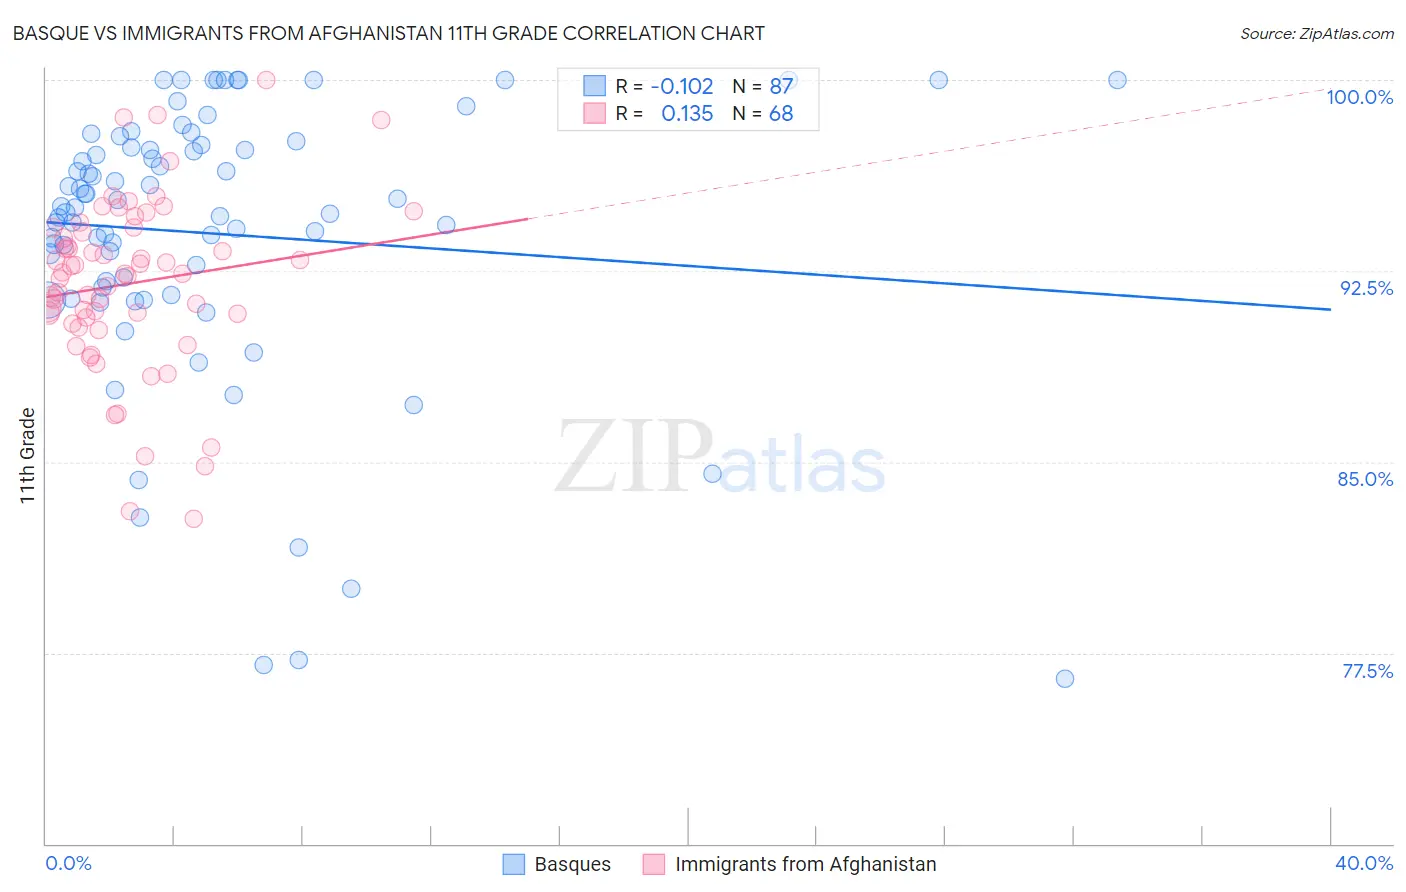
Basque vs Immigrants from Afghanistan 11th Grade Correlation Chart
The statistical analysis conducted on geographies consisting of 165,777,136 people shows a poor negative correlation between the proportion of Basques and percentage of population with at least 11th grade education in the United States with a correlation coefficient (R) of -0.102 and weighted average of 93.2%. Similarly, the statistical analysis conducted on geographies consisting of 147,629,924 people shows a poor positive correlation between the proportion of Immigrants from Afghanistan and percentage of population with at least 11th grade education in the United States with a correlation coefficient (R) of 0.135 and weighted average of 91.8%, a difference of 1.5%.
11th Grade Correlation Summary
| Measurement | Basque | Immigrants from Afghanistan |
| Minimum | 76.5% | 82.8% |
| Maximum | 100.0% | 100.0% |
| Range | 23.5% | 17.2% |
| Mean | 94.0% | 92.0% |
| Median | 95.0% | 92.4% |
| Interquartile 25% (IQ1) | 91.9% | 90.6% |
| Interquartile 75% (IQ3) | 97.5% | 94.1% |
| Interquartile Range (IQR) | 5.6% | 3.6% |
| Standard Deviation (Sample) | 5.4% | 3.4% |
| Standard Deviation (Population) | 5.4% | 3.4% |
Similar Demographics by 11th Grade
Demographics Similar to Basques by 11th Grade
In terms of 11th grade, the demographic groups most similar to Basques are Immigrants from Sri Lanka (93.2%, a difference of 0.020%), Immigrants from Greece (93.2%, a difference of 0.040%), Immigrants from Eastern Europe (93.2%, a difference of 0.040%), German Russian (93.3%, a difference of 0.070%), and Immigrants from Belarus (93.3%, a difference of 0.070%).
| Demographics | Rating | Rank | 11th Grade |
| Israelis | 97.0 /100 | #119 | Exceptional 93.3% |
| Immigrants | Russia | 96.6 /100 | #120 | Exceptional 93.3% |
| German Russians | 96.4 /100 | #121 | Exceptional 93.3% |
| Immigrants | Belarus | 96.3 /100 | #122 | Exceptional 93.3% |
| Immigrants | Greece | 95.9 /100 | #123 | Exceptional 93.2% |
| Immigrants | Eastern Europe | 95.9 /100 | #124 | Exceptional 93.2% |
| Immigrants | Sri Lanka | 95.6 /100 | #125 | Exceptional 93.2% |
| Basques | 95.2 /100 | #126 | Exceptional 93.2% |
| Immigrants | Kazakhstan | 92.4 /100 | #127 | Exceptional 93.1% |
| Immigrants | Jordan | 92.4 /100 | #128 | Exceptional 93.1% |
| Immigrants | Ukraine | 89.8 /100 | #129 | Excellent 93.0% |
| Albanians | 89.5 /100 | #130 | Excellent 93.0% |
| Egyptians | 89.5 /100 | #131 | Excellent 93.0% |
| Immigrants | Bosnia and Herzegovina | 89.0 /100 | #132 | Excellent 93.0% |
| Mongolians | 87.6 /100 | #133 | Excellent 93.0% |
Demographics Similar to Immigrants from Afghanistan by 11th Grade
In terms of 11th grade, the demographic groups most similar to Immigrants from Afghanistan are Choctaw (91.8%, a difference of 0.010%), Immigrants from Cameroon (91.8%, a difference of 0.030%), Immigrants from Panama (91.8%, a difference of 0.030%), Nigerian (91.8%, a difference of 0.030%), and Uruguayan (91.8%, a difference of 0.030%).
| Demographics | Rating | Rank | 11th Grade |
| Immigrants | Bahamas | 6.5 /100 | #223 | Tragic 91.9% |
| Costa Ricans | 6.3 /100 | #224 | Tragic 91.9% |
| Immigrants | Zaire | 5.4 /100 | #225 | Tragic 91.9% |
| Immigrants | Somalia | 5.2 /100 | #226 | Tragic 91.9% |
| Immigrants | Cameroon | 4.4 /100 | #227 | Tragic 91.8% |
| Immigrants | Panama | 4.3 /100 | #228 | Tragic 91.8% |
| Nigerians | 4.3 /100 | #229 | Tragic 91.8% |
| Immigrants | Afghanistan | 3.9 /100 | #230 | Tragic 91.8% |
| Choctaw | 3.7 /100 | #231 | Tragic 91.8% |
| Uruguayans | 3.5 /100 | #232 | Tragic 91.8% |
| Cheyenne | 3.3 /100 | #233 | Tragic 91.8% |
| Armenians | 2.9 /100 | #234 | Tragic 91.7% |
| Sub-Saharan Africans | 2.9 /100 | #235 | Tragic 91.7% |
| Colombians | 2.8 /100 | #236 | Tragic 91.7% |
| Immigrants | Bolivia | 2.8 /100 | #237 | Tragic 91.7% |