Basque vs Bulgarian 11th Grade
COMPARE
Basque
Bulgarian
11th Grade
11th Grade Comparison
Basques
Bulgarians
93.2%
11TH GRADE
95.2/ 100
METRIC RATING
126th/ 347
METRIC RANK
94.5%
11TH GRADE
100.0/ 100
METRIC RATING
15th/ 347
METRIC RANK
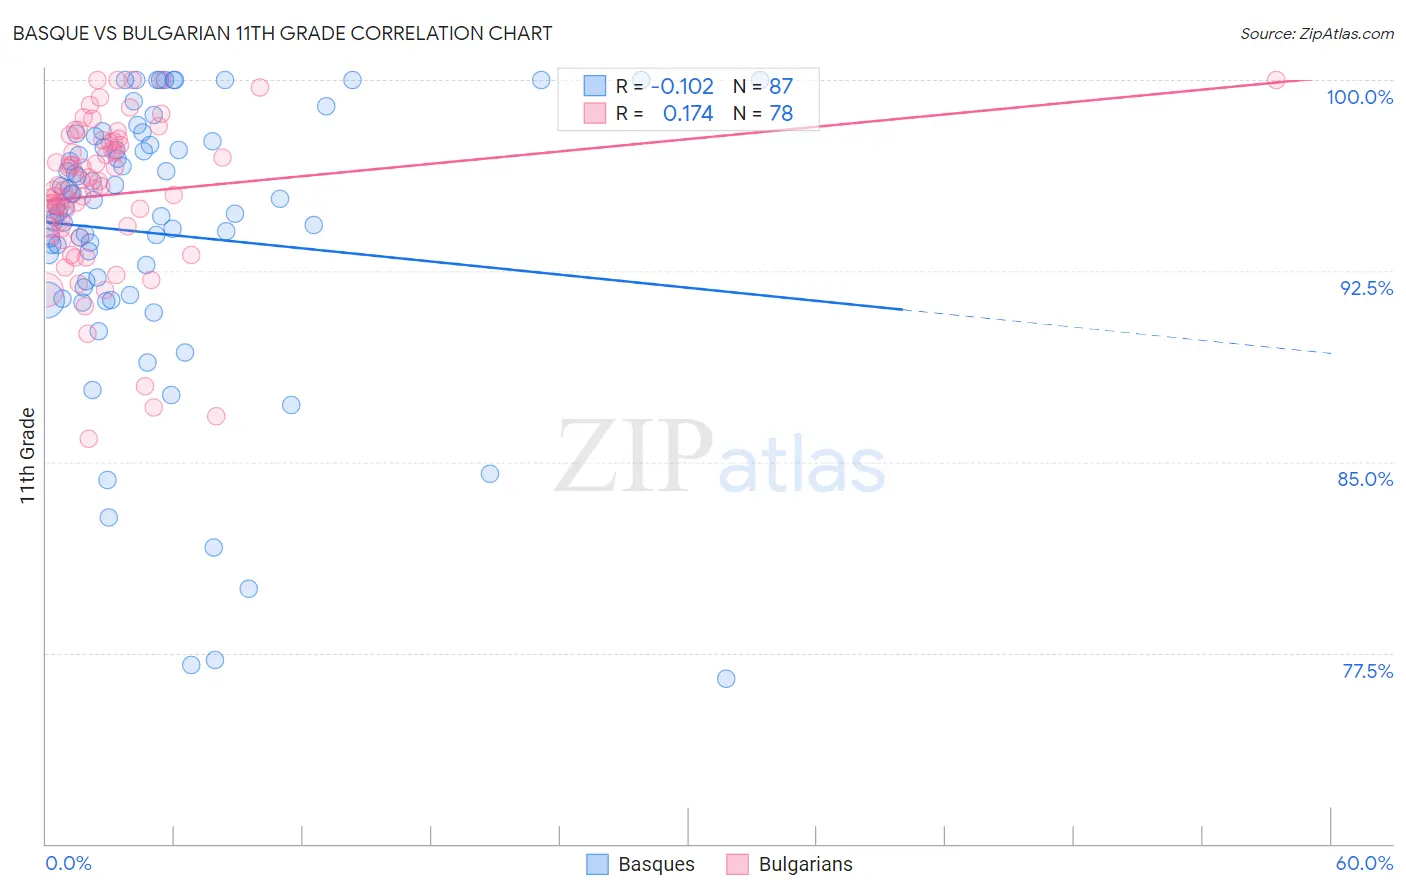
Basque vs Bulgarian 11th Grade Correlation Chart
The statistical analysis conducted on geographies consisting of 165,777,136 people shows a poor negative correlation between the proportion of Basques and percentage of population with at least 11th grade education in the United States with a correlation coefficient (R) of -0.102 and weighted average of 93.2%. Similarly, the statistical analysis conducted on geographies consisting of 205,633,404 people shows a poor positive correlation between the proportion of Bulgarians and percentage of population with at least 11th grade education in the United States with a correlation coefficient (R) of 0.174 and weighted average of 94.5%, a difference of 1.4%.
11th Grade Correlation Summary
| Measurement | Basque | Bulgarian |
| Minimum | 76.5% | 85.9% |
| Maximum | 100.0% | 100.0% |
| Range | 23.5% | 14.1% |
| Mean | 94.0% | 95.5% |
| Median | 95.0% | 95.8% |
| Interquartile 25% (IQ1) | 91.9% | 94.2% |
| Interquartile 75% (IQ3) | 97.5% | 97.6% |
| Interquartile Range (IQR) | 5.6% | 3.4% |
| Standard Deviation (Sample) | 5.4% | 3.0% |
| Standard Deviation (Population) | 5.4% | 3.0% |
Similar Demographics by 11th Grade
Demographics Similar to Basques by 11th Grade
In terms of 11th grade, the demographic groups most similar to Basques are Immigrants from Sri Lanka (93.2%, a difference of 0.020%), Immigrants from Greece (93.2%, a difference of 0.040%), Immigrants from Eastern Europe (93.2%, a difference of 0.040%), German Russian (93.3%, a difference of 0.070%), and Immigrants from Belarus (93.3%, a difference of 0.070%).
| Demographics | Rating | Rank | 11th Grade |
| Israelis | 97.0 /100 | #119 | Exceptional 93.3% |
| Immigrants | Russia | 96.6 /100 | #120 | Exceptional 93.3% |
| German Russians | 96.4 /100 | #121 | Exceptional 93.3% |
| Immigrants | Belarus | 96.3 /100 | #122 | Exceptional 93.3% |
| Immigrants | Greece | 95.9 /100 | #123 | Exceptional 93.2% |
| Immigrants | Eastern Europe | 95.9 /100 | #124 | Exceptional 93.2% |
| Immigrants | Sri Lanka | 95.6 /100 | #125 | Exceptional 93.2% |
| Basques | 95.2 /100 | #126 | Exceptional 93.2% |
| Immigrants | Kazakhstan | 92.4 /100 | #127 | Exceptional 93.1% |
| Immigrants | Jordan | 92.4 /100 | #128 | Exceptional 93.1% |
| Immigrants | Ukraine | 89.8 /100 | #129 | Excellent 93.0% |
| Albanians | 89.5 /100 | #130 | Excellent 93.0% |
| Egyptians | 89.5 /100 | #131 | Excellent 93.0% |
| Immigrants | Bosnia and Herzegovina | 89.0 /100 | #132 | Excellent 93.0% |
| Mongolians | 87.6 /100 | #133 | Excellent 93.0% |
Demographics Similar to Bulgarians by 11th Grade
In terms of 11th grade, the demographic groups most similar to Bulgarians are Immigrants from India (94.5%, a difference of 0.010%), Luxembourger (94.5%, a difference of 0.010%), Maltese (94.5%, a difference of 0.010%), Scandinavian (94.5%, a difference of 0.010%), and Italian (94.5%, a difference of 0.050%).
| Demographics | Rating | Rank | 11th Grade |
| Croatians | 100.0 /100 | #8 | Exceptional 94.7% |
| Danes | 100.0 /100 | #9 | Exceptional 94.7% |
| Finns | 100.0 /100 | #10 | Exceptional 94.7% |
| Germans | 100.0 /100 | #11 | Exceptional 94.7% |
| Latvians | 100.0 /100 | #12 | Exceptional 94.7% |
| Chinese | 100.0 /100 | #13 | Exceptional 94.6% |
| Eastern Europeans | 100.0 /100 | #14 | Exceptional 94.6% |
| Bulgarians | 100.0 /100 | #15 | Exceptional 94.5% |
| Immigrants | India | 100.0 /100 | #16 | Exceptional 94.5% |
| Luxembourgers | 100.0 /100 | #17 | Exceptional 94.5% |
| Maltese | 100.0 /100 | #18 | Exceptional 94.5% |
| Scandinavians | 100.0 /100 | #19 | Exceptional 94.5% |
| Italians | 100.0 /100 | #20 | Exceptional 94.5% |
| Tlingit-Haida | 100.0 /100 | #21 | Exceptional 94.4% |
| Tsimshian | 100.0 /100 | #22 | Exceptional 94.4% |