Czech vs Immigrants from Afghanistan 11th Grade
COMPARE
Czech
Immigrants from Afghanistan
11th Grade
11th Grade Comparison
Czechs
Immigrants from Afghanistan
94.4%
11TH GRADE
100.0/ 100
METRIC RATING
23rd/ 347
METRIC RANK
91.8%
11TH GRADE
3.9/ 100
METRIC RATING
230th/ 347
METRIC RANK
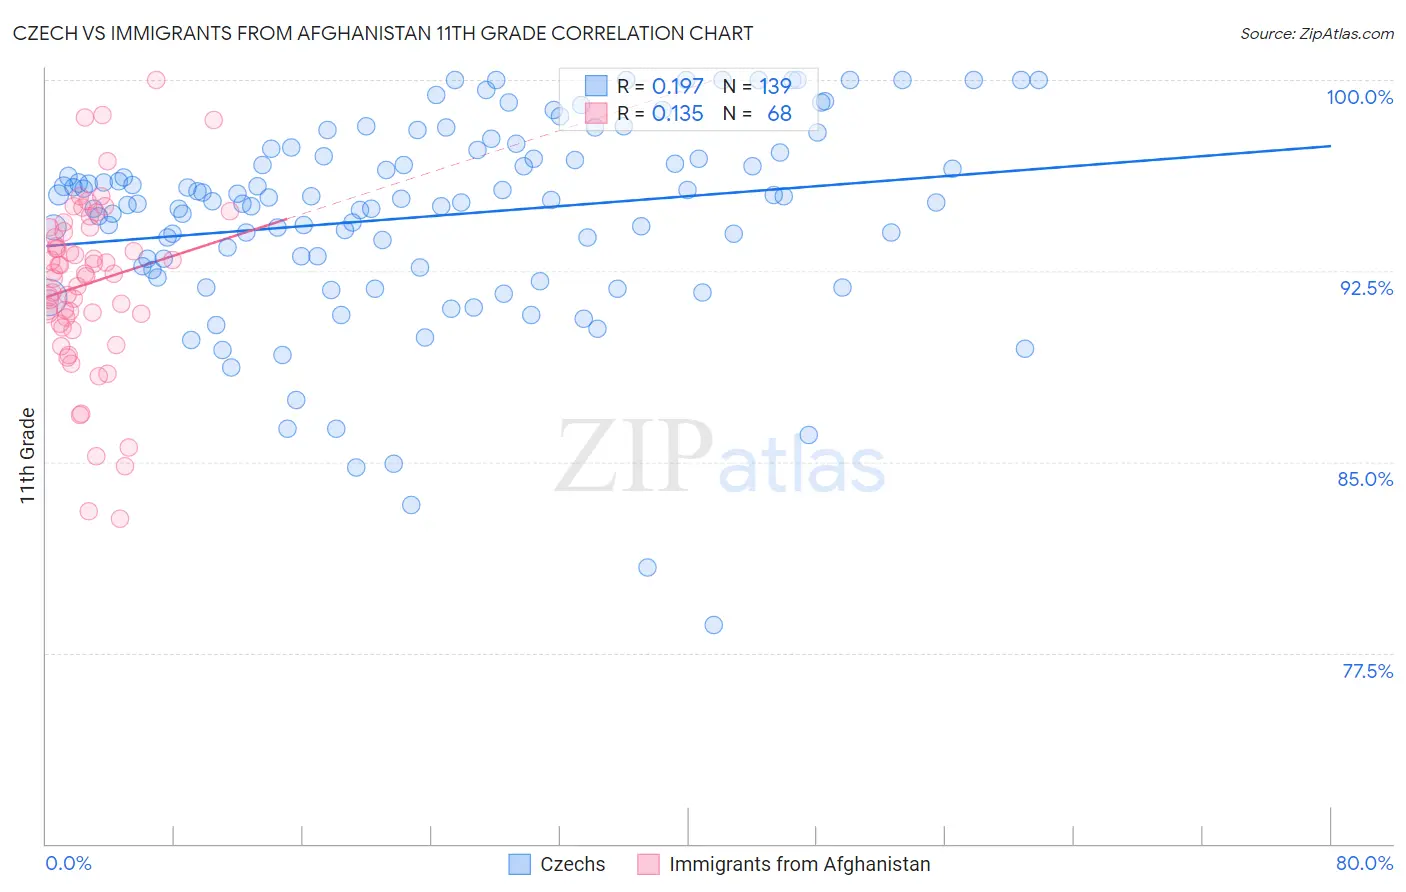
Czech vs Immigrants from Afghanistan 11th Grade Correlation Chart
The statistical analysis conducted on geographies consisting of 484,813,868 people shows a poor positive correlation between the proportion of Czechs and percentage of population with at least 11th grade education in the United States with a correlation coefficient (R) of 0.197 and weighted average of 94.4%. Similarly, the statistical analysis conducted on geographies consisting of 147,629,924 people shows a poor positive correlation between the proportion of Immigrants from Afghanistan and percentage of population with at least 11th grade education in the United States with a correlation coefficient (R) of 0.135 and weighted average of 91.8%, a difference of 2.9%.
11th Grade Correlation Summary
| Measurement | Czech | Immigrants from Afghanistan |
| Minimum | 78.6% | 82.8% |
| Maximum | 100.0% | 100.0% |
| Range | 21.4% | 17.2% |
| Mean | 94.7% | 92.0% |
| Median | 95.3% | 92.4% |
| Interquartile 25% (IQ1) | 92.7% | 90.6% |
| Interquartile 75% (IQ3) | 97.2% | 94.1% |
| Interquartile Range (IQR) | 4.5% | 3.6% |
| Standard Deviation (Sample) | 4.0% | 3.4% |
| Standard Deviation (Population) | 4.0% | 3.4% |
Similar Demographics by 11th Grade
Demographics Similar to Czechs by 11th Grade
In terms of 11th grade, the demographic groups most similar to Czechs are Tsimshian (94.4%, a difference of 0.0%), Tlingit-Haida (94.4%, a difference of 0.010%), Italian (94.5%, a difference of 0.030%), English (94.4%, a difference of 0.030%), and Irish (94.4%, a difference of 0.050%).
| Demographics | Rating | Rank | 11th Grade |
| Immigrants | India | 100.0 /100 | #16 | Exceptional 94.5% |
| Luxembourgers | 100.0 /100 | #17 | Exceptional 94.5% |
| Maltese | 100.0 /100 | #18 | Exceptional 94.5% |
| Scandinavians | 100.0 /100 | #19 | Exceptional 94.5% |
| Italians | 100.0 /100 | #20 | Exceptional 94.5% |
| Tlingit-Haida | 100.0 /100 | #21 | Exceptional 94.4% |
| Tsimshian | 100.0 /100 | #22 | Exceptional 94.4% |
| Czechs | 100.0 /100 | #23 | Exceptional 94.4% |
| English | 100.0 /100 | #24 | Exceptional 94.4% |
| Irish | 100.0 /100 | #25 | Exceptional 94.4% |
| Scottish | 100.0 /100 | #26 | Exceptional 94.4% |
| Europeans | 100.0 /100 | #27 | Exceptional 94.4% |
| Estonians | 100.0 /100 | #28 | Exceptional 94.4% |
| Dutch | 100.0 /100 | #29 | Exceptional 94.3% |
| Russians | 100.0 /100 | #30 | Exceptional 94.3% |
Demographics Similar to Immigrants from Afghanistan by 11th Grade
In terms of 11th grade, the demographic groups most similar to Immigrants from Afghanistan are Choctaw (91.8%, a difference of 0.010%), Immigrants from Cameroon (91.8%, a difference of 0.030%), Immigrants from Panama (91.8%, a difference of 0.030%), Nigerian (91.8%, a difference of 0.030%), and Uruguayan (91.8%, a difference of 0.030%).
| Demographics | Rating | Rank | 11th Grade |
| Immigrants | Bahamas | 6.5 /100 | #223 | Tragic 91.9% |
| Costa Ricans | 6.3 /100 | #224 | Tragic 91.9% |
| Immigrants | Zaire | 5.4 /100 | #225 | Tragic 91.9% |
| Immigrants | Somalia | 5.2 /100 | #226 | Tragic 91.9% |
| Immigrants | Cameroon | 4.4 /100 | #227 | Tragic 91.8% |
| Immigrants | Panama | 4.3 /100 | #228 | Tragic 91.8% |
| Nigerians | 4.3 /100 | #229 | Tragic 91.8% |
| Immigrants | Afghanistan | 3.9 /100 | #230 | Tragic 91.8% |
| Choctaw | 3.7 /100 | #231 | Tragic 91.8% |
| Uruguayans | 3.5 /100 | #232 | Tragic 91.8% |
| Cheyenne | 3.3 /100 | #233 | Tragic 91.8% |
| Armenians | 2.9 /100 | #234 | Tragic 91.7% |
| Sub-Saharan Africans | 2.9 /100 | #235 | Tragic 91.7% |
| Colombians | 2.8 /100 | #236 | Tragic 91.7% |
| Immigrants | Bolivia | 2.8 /100 | #237 | Tragic 91.7% |