South American vs Immigrants from Afghanistan 11th Grade
COMPARE
South American
Immigrants from Afghanistan
11th Grade
11th Grade Comparison
South Americans
Immigrants from Afghanistan
91.6%
11TH GRADE
2.0/ 100
METRIC RATING
240th/ 347
METRIC RANK
91.8%
11TH GRADE
3.9/ 100
METRIC RATING
230th/ 347
METRIC RANK
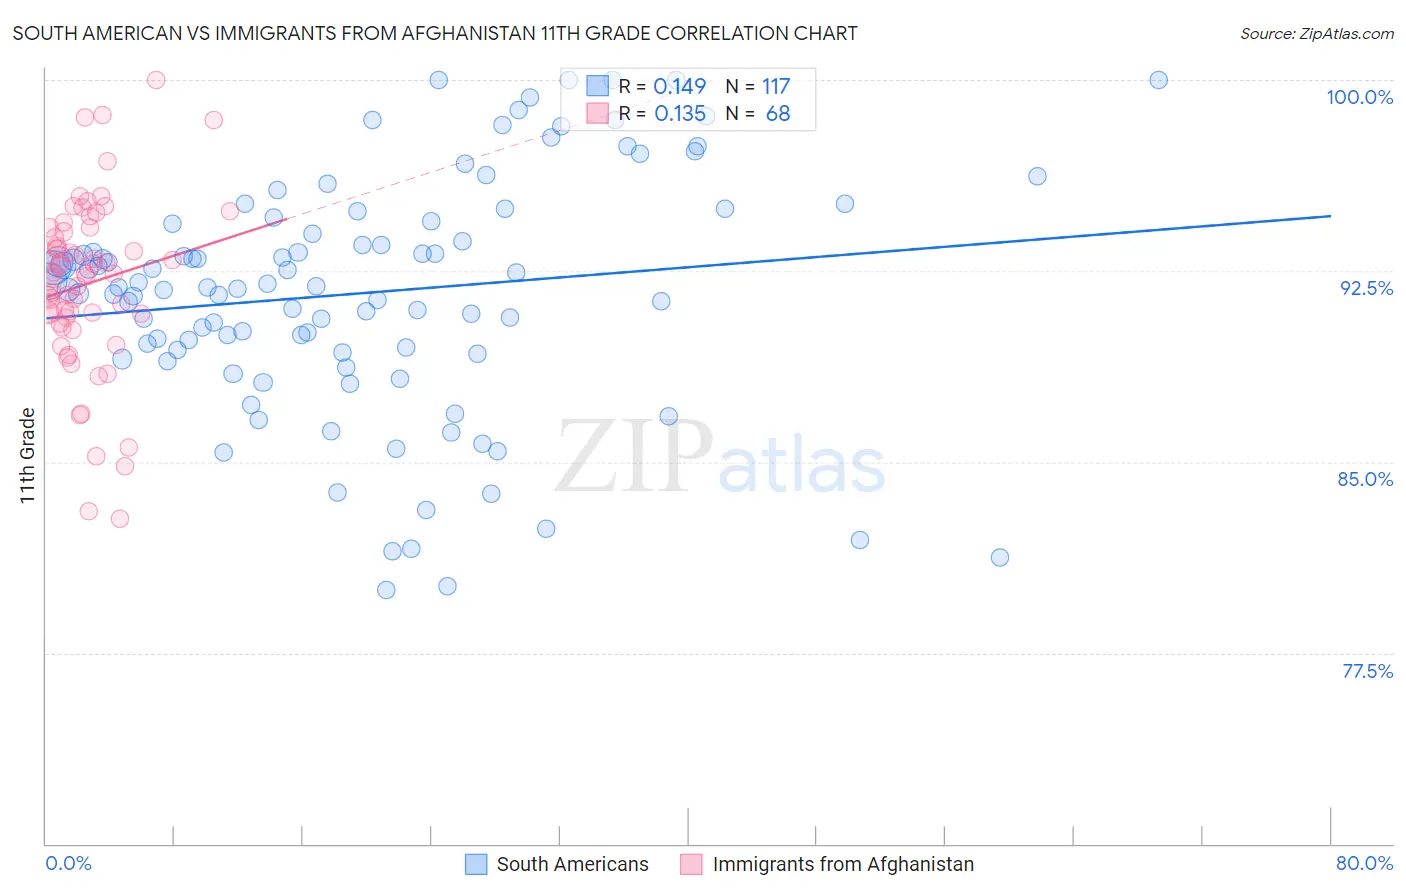
South American vs Immigrants from Afghanistan 11th Grade Correlation Chart
The statistical analysis conducted on geographies consisting of 494,065,729 people shows a poor positive correlation between the proportion of South Americans and percentage of population with at least 11th grade education in the United States with a correlation coefficient (R) of 0.149 and weighted average of 91.6%. Similarly, the statistical analysis conducted on geographies consisting of 147,629,924 people shows a poor positive correlation between the proportion of Immigrants from Afghanistan and percentage of population with at least 11th grade education in the United States with a correlation coefficient (R) of 0.135 and weighted average of 91.8%, a difference of 0.17%.
11th Grade Correlation Summary
| Measurement | South American | Immigrants from Afghanistan |
| Minimum | 80.0% | 82.8% |
| Maximum | 100.0% | 100.0% |
| Range | 20.0% | 17.2% |
| Mean | 91.6% | 92.0% |
| Median | 91.9% | 92.4% |
| Interquartile 25% (IQ1) | 89.4% | 90.6% |
| Interquartile 75% (IQ3) | 94.4% | 94.1% |
| Interquartile Range (IQR) | 5.0% | 3.6% |
| Standard Deviation (Sample) | 4.6% | 3.4% |
| Standard Deviation (Population) | 4.6% | 3.4% |
Demographics Similar to South Americans and Immigrants from Afghanistan by 11th Grade
In terms of 11th grade, the demographic groups most similar to South Americans are Bahamian (91.6%, a difference of 0.020%), Immigrants from Middle Africa (91.6%, a difference of 0.050%), Hopi (91.7%, a difference of 0.060%), Comanche (91.7%, a difference of 0.070%), and Immigrants from Thailand (91.6%, a difference of 0.080%). Similarly, the demographic groups most similar to Immigrants from Afghanistan are Choctaw (91.8%, a difference of 0.010%), Immigrants from Cameroon (91.8%, a difference of 0.030%), Immigrants from Panama (91.8%, a difference of 0.030%), Nigerian (91.8%, a difference of 0.030%), and Uruguayan (91.8%, a difference of 0.030%).
| Demographics | Rating | Rank | 11th Grade |
| Immigrants | Zaire | 5.4 /100 | #225 | Tragic 91.9% |
| Immigrants | Somalia | 5.2 /100 | #226 | Tragic 91.9% |
| Immigrants | Cameroon | 4.4 /100 | #227 | Tragic 91.8% |
| Immigrants | Panama | 4.3 /100 | #228 | Tragic 91.8% |
| Nigerians | 4.3 /100 | #229 | Tragic 91.8% |
| Immigrants | Afghanistan | 3.9 /100 | #230 | Tragic 91.8% |
| Choctaw | 3.7 /100 | #231 | Tragic 91.8% |
| Uruguayans | 3.5 /100 | #232 | Tragic 91.8% |
| Cheyenne | 3.3 /100 | #233 | Tragic 91.8% |
| Armenians | 2.9 /100 | #234 | Tragic 91.7% |
| Sub-Saharan Africans | 2.9 /100 | #235 | Tragic 91.7% |
| Colombians | 2.8 /100 | #236 | Tragic 91.7% |
| Immigrants | Bolivia | 2.8 /100 | #237 | Tragic 91.7% |
| Comanche | 2.6 /100 | #238 | Tragic 91.7% |
| Hopi | 2.5 /100 | #239 | Tragic 91.7% |
| South Americans | 2.0 /100 | #240 | Tragic 91.6% |
| Bahamians | 1.8 /100 | #241 | Tragic 91.6% |
| Immigrants | Middle Africa | 1.6 /100 | #242 | Tragic 91.6% |
| Immigrants | Thailand | 1.4 /100 | #243 | Tragic 91.6% |
| Senegalese | 1.4 /100 | #244 | Tragic 91.6% |
| Africans | 1.3 /100 | #245 | Tragic 91.5% |