Basque vs Immigrants from Indonesia 11th Grade
COMPARE
Basque
Immigrants from Indonesia
11th Grade
11th Grade Comparison
Basques
Immigrants from Indonesia
93.2%
11TH GRADE
95.2/ 100
METRIC RATING
126th/ 347
METRIC RANK
92.4%
11TH GRADE
33.7/ 100
METRIC RATING
188th/ 347
METRIC RANK
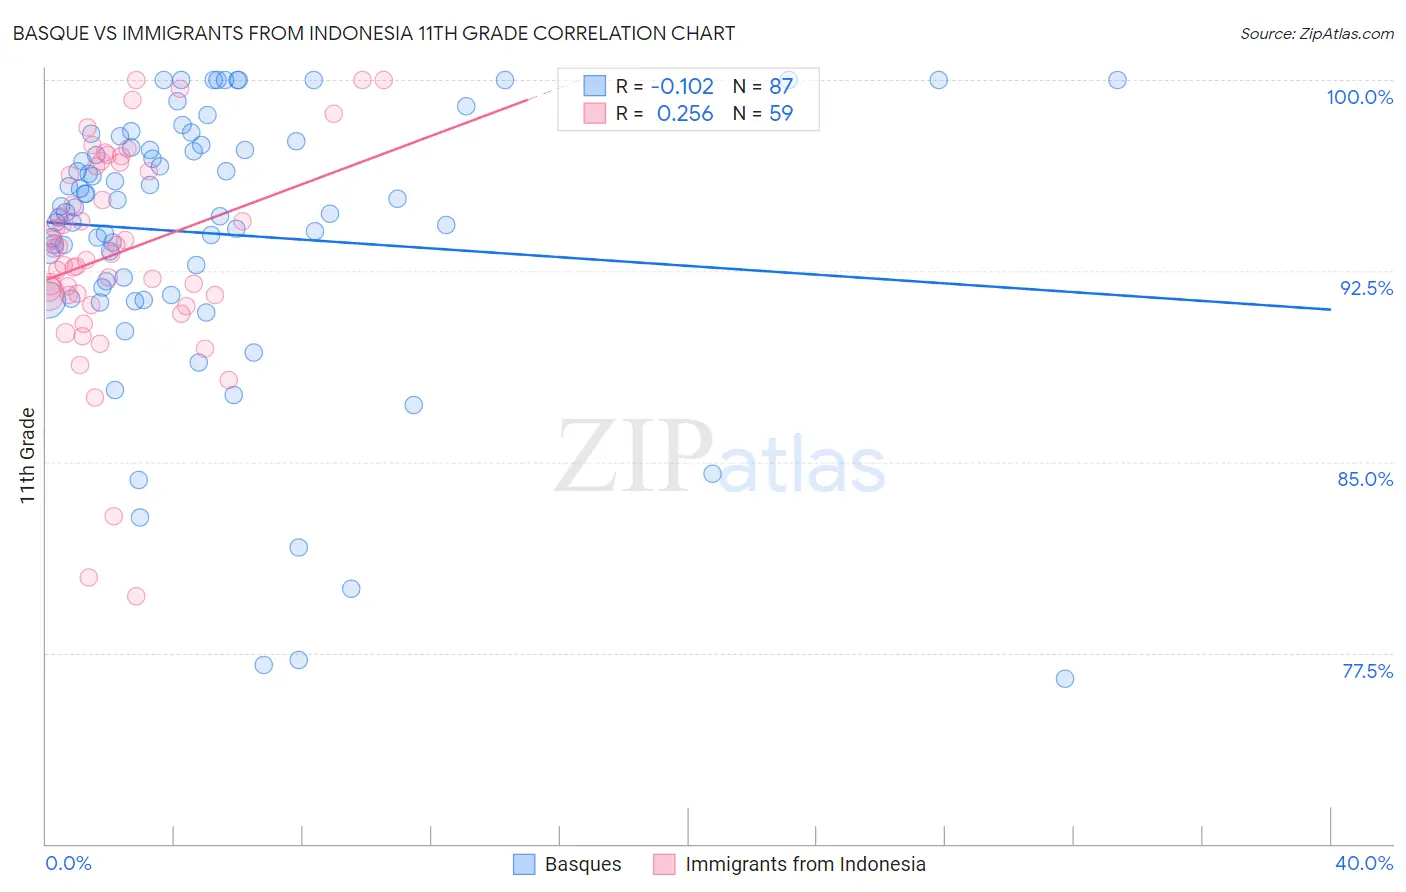
Basque vs Immigrants from Indonesia 11th Grade Correlation Chart
The statistical analysis conducted on geographies consisting of 165,777,136 people shows a poor negative correlation between the proportion of Basques and percentage of population with at least 11th grade education in the United States with a correlation coefficient (R) of -0.102 and weighted average of 93.2%. Similarly, the statistical analysis conducted on geographies consisting of 215,778,424 people shows a weak positive correlation between the proportion of Immigrants from Indonesia and percentage of population with at least 11th grade education in the United States with a correlation coefficient (R) of 0.256 and weighted average of 92.4%, a difference of 0.90%.
11th Grade Correlation Summary
| Measurement | Basque | Immigrants from Indonesia |
| Minimum | 76.5% | 79.7% |
| Maximum | 100.0% | 100.0% |
| Range | 23.5% | 20.3% |
| Mean | 94.0% | 93.2% |
| Median | 95.0% | 93.2% |
| Interquartile 25% (IQ1) | 91.9% | 91.5% |
| Interquartile 75% (IQ3) | 97.5% | 96.6% |
| Interquartile Range (IQR) | 5.6% | 5.1% |
| Standard Deviation (Sample) | 5.4% | 4.2% |
| Standard Deviation (Population) | 5.4% | 4.2% |
Similar Demographics by 11th Grade
Demographics Similar to Basques by 11th Grade
In terms of 11th grade, the demographic groups most similar to Basques are Immigrants from Sri Lanka (93.2%, a difference of 0.020%), Immigrants from Greece (93.2%, a difference of 0.040%), Immigrants from Eastern Europe (93.2%, a difference of 0.040%), German Russian (93.3%, a difference of 0.070%), and Immigrants from Belarus (93.3%, a difference of 0.070%).
| Demographics | Rating | Rank | 11th Grade |
| Israelis | 97.0 /100 | #119 | Exceptional 93.3% |
| Immigrants | Russia | 96.6 /100 | #120 | Exceptional 93.3% |
| German Russians | 96.4 /100 | #121 | Exceptional 93.3% |
| Immigrants | Belarus | 96.3 /100 | #122 | Exceptional 93.3% |
| Immigrants | Greece | 95.9 /100 | #123 | Exceptional 93.2% |
| Immigrants | Eastern Europe | 95.9 /100 | #124 | Exceptional 93.2% |
| Immigrants | Sri Lanka | 95.6 /100 | #125 | Exceptional 93.2% |
| Basques | 95.2 /100 | #126 | Exceptional 93.2% |
| Immigrants | Kazakhstan | 92.4 /100 | #127 | Exceptional 93.1% |
| Immigrants | Jordan | 92.4 /100 | #128 | Exceptional 93.1% |
| Immigrants | Ukraine | 89.8 /100 | #129 | Excellent 93.0% |
| Albanians | 89.5 /100 | #130 | Excellent 93.0% |
| Egyptians | 89.5 /100 | #131 | Excellent 93.0% |
| Immigrants | Bosnia and Herzegovina | 89.0 /100 | #132 | Excellent 93.0% |
| Mongolians | 87.6 /100 | #133 | Excellent 93.0% |
Demographics Similar to Immigrants from Indonesia by 11th Grade
In terms of 11th grade, the demographic groups most similar to Immigrants from Indonesia are Immigrants from Chile (92.4%, a difference of 0.0%), Immigrants from Western Asia (92.4%, a difference of 0.010%), Arapaho (92.4%, a difference of 0.020%), Immigrants from Nepal (92.4%, a difference of 0.030%), and Chickasaw (92.3%, a difference of 0.030%).
| Demographics | Rating | Rank | 11th Grade |
| Cherokee | 40.7 /100 | #181 | Average 92.4% |
| Immigrants | Morocco | 38.6 /100 | #182 | Fair 92.4% |
| Immigrants | Malaysia | 37.6 /100 | #183 | Fair 92.4% |
| Immigrants | Asia | 37.4 /100 | #184 | Fair 92.4% |
| Immigrants | Nepal | 36.4 /100 | #185 | Fair 92.4% |
| Arapaho | 35.1 /100 | #186 | Fair 92.4% |
| Immigrants | Western Asia | 35.0 /100 | #187 | Fair 92.4% |
| Immigrants | Indonesia | 33.7 /100 | #188 | Fair 92.4% |
| Immigrants | Chile | 33.3 /100 | #189 | Fair 92.4% |
| Chickasaw | 31.4 /100 | #190 | Fair 92.3% |
| French American Indians | 30.8 /100 | #191 | Fair 92.3% |
| Immigrants | Syria | 30.4 /100 | #192 | Fair 92.3% |
| Moroccans | 28.7 /100 | #193 | Fair 92.3% |
| Sioux | 28.5 /100 | #194 | Fair 92.3% |
| Liberians | 26.8 /100 | #195 | Fair 92.3% |