Basque vs Menominee 11th Grade
COMPARE
Basque
Menominee
11th Grade
11th Grade Comparison
Basques
Menominee
93.2%
11TH GRADE
95.2/ 100
METRIC RATING
126th/ 347
METRIC RANK
93.5%
11TH GRADE
98.7/ 100
METRIC RATING
99th/ 347
METRIC RANK
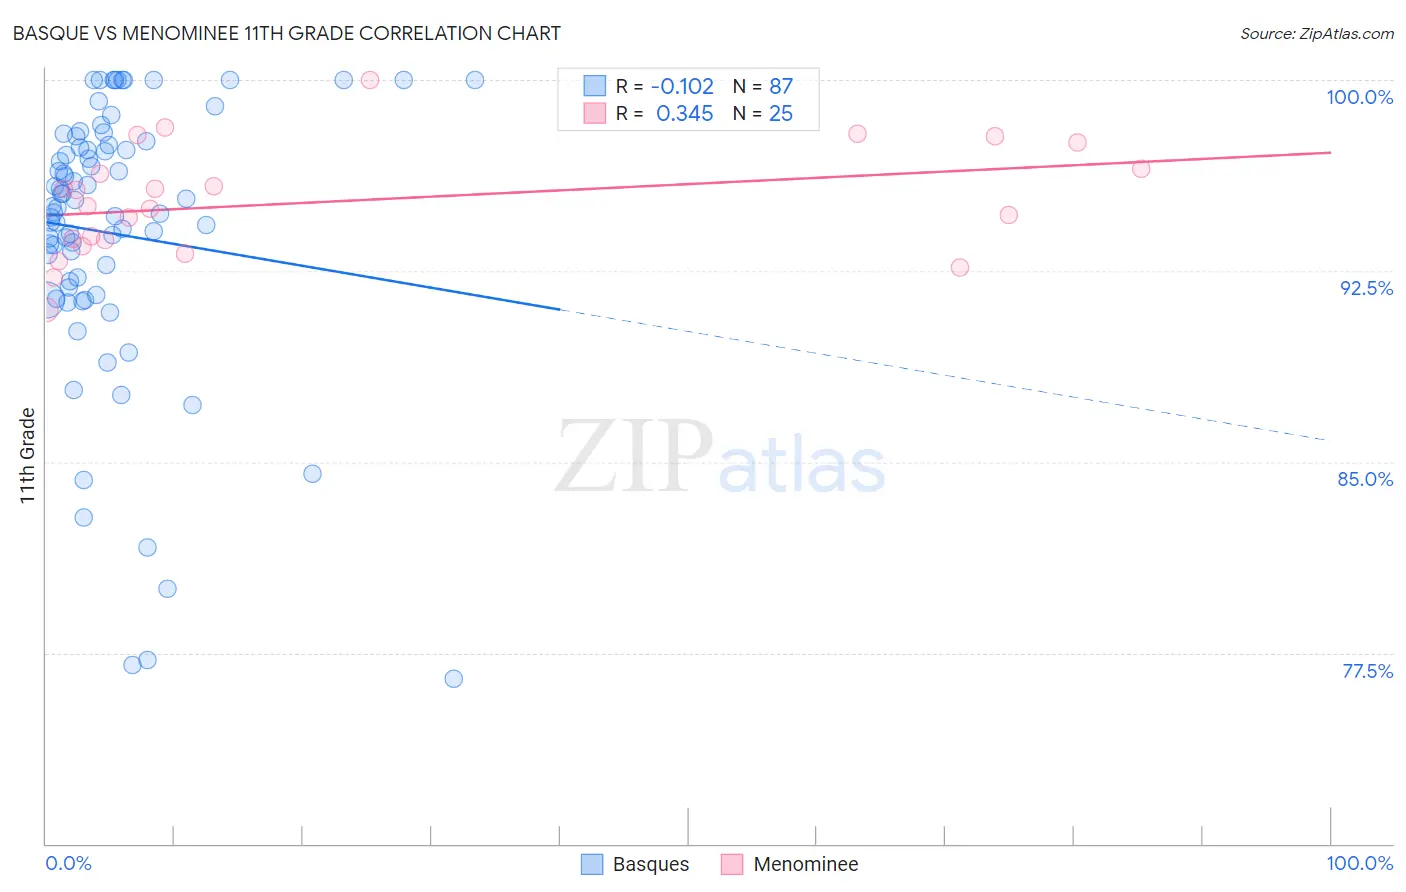
Basque vs Menominee 11th Grade Correlation Chart
The statistical analysis conducted on geographies consisting of 165,777,136 people shows a poor negative correlation between the proportion of Basques and percentage of population with at least 11th grade education in the United States with a correlation coefficient (R) of -0.102 and weighted average of 93.2%. Similarly, the statistical analysis conducted on geographies consisting of 45,778,829 people shows a mild positive correlation between the proportion of Menominee and percentage of population with at least 11th grade education in the United States with a correlation coefficient (R) of 0.345 and weighted average of 93.5%, a difference of 0.34%.
11th Grade Correlation Summary
| Measurement | Basque | Menominee |
| Minimum | 76.5% | 91.0% |
| Maximum | 100.0% | 100.0% |
| Range | 23.5% | 9.0% |
| Mean | 94.0% | 95.2% |
| Median | 95.0% | 95.0% |
| Interquartile 25% (IQ1) | 91.9% | 93.6% |
| Interquartile 75% (IQ3) | 97.5% | 97.0% |
| Interquartile Range (IQR) | 5.6% | 3.4% |
| Standard Deviation (Sample) | 5.4% | 2.2% |
| Standard Deviation (Population) | 5.4% | 2.1% |
Similar Demographics by 11th Grade
Demographics Similar to Basques by 11th Grade
In terms of 11th grade, the demographic groups most similar to Basques are Immigrants from Sri Lanka (93.2%, a difference of 0.020%), Immigrants from Greece (93.2%, a difference of 0.040%), Immigrants from Eastern Europe (93.2%, a difference of 0.040%), German Russian (93.3%, a difference of 0.070%), and Immigrants from Belarus (93.3%, a difference of 0.070%).
| Demographics | Rating | Rank | 11th Grade |
| Israelis | 97.0 /100 | #119 | Exceptional 93.3% |
| Immigrants | Russia | 96.6 /100 | #120 | Exceptional 93.3% |
| German Russians | 96.4 /100 | #121 | Exceptional 93.3% |
| Immigrants | Belarus | 96.3 /100 | #122 | Exceptional 93.3% |
| Immigrants | Greece | 95.9 /100 | #123 | Exceptional 93.2% |
| Immigrants | Eastern Europe | 95.9 /100 | #124 | Exceptional 93.2% |
| Immigrants | Sri Lanka | 95.6 /100 | #125 | Exceptional 93.2% |
| Basques | 95.2 /100 | #126 | Exceptional 93.2% |
| Immigrants | Kazakhstan | 92.4 /100 | #127 | Exceptional 93.1% |
| Immigrants | Jordan | 92.4 /100 | #128 | Exceptional 93.1% |
| Immigrants | Ukraine | 89.8 /100 | #129 | Excellent 93.0% |
| Albanians | 89.5 /100 | #130 | Excellent 93.0% |
| Egyptians | 89.5 /100 | #131 | Excellent 93.0% |
| Immigrants | Bosnia and Herzegovina | 89.0 /100 | #132 | Excellent 93.0% |
| Mongolians | 87.6 /100 | #133 | Excellent 93.0% |
Demographics Similar to Menominee by 11th Grade
In terms of 11th grade, the demographic groups most similar to Menominee are Immigrants from Israel (93.5%, a difference of 0.0%), Immigrants from North Macedonia (93.5%, a difference of 0.010%), Immigrants from Iran (93.5%, a difference of 0.020%), Immigrants from Romania (93.5%, a difference of 0.020%), and Immigrants from Turkey (93.5%, a difference of 0.030%).
| Demographics | Rating | Rank | 11th Grade |
| Immigrants | Bulgaria | 99.1 /100 | #92 | Exceptional 93.6% |
| Puget Sound Salish | 99.1 /100 | #93 | Exceptional 93.6% |
| Swiss | 99.0 /100 | #94 | Exceptional 93.6% |
| Immigrants | France | 99.0 /100 | #95 | Exceptional 93.6% |
| Immigrants | Turkey | 98.9 /100 | #96 | Exceptional 93.5% |
| Immigrants | Iran | 98.9 /100 | #97 | Exceptional 93.5% |
| Immigrants | Israel | 98.8 /100 | #98 | Exceptional 93.5% |
| Menominee | 98.7 /100 | #99 | Exceptional 93.5% |
| Immigrants | North Macedonia | 98.7 /100 | #100 | Exceptional 93.5% |
| Immigrants | Romania | 98.7 /100 | #101 | Exceptional 93.5% |
| Chippewa | 98.6 /100 | #102 | Exceptional 93.5% |
| Lebanese | 98.6 /100 | #103 | Exceptional 93.5% |
| Immigrants | Europe | 98.6 /100 | #104 | Exceptional 93.5% |
| Immigrants | Serbia | 98.6 /100 | #105 | Exceptional 93.5% |
| Immigrants | Croatia | 98.6 /100 | #106 | Exceptional 93.5% |