Immigrants from Philippines vs Immigrants from Afghanistan 11th Grade
COMPARE
Immigrants from Philippines
Immigrants from Afghanistan
11th Grade
11th Grade Comparison
Immigrants from Philippines
Immigrants from Afghanistan
91.5%
11TH GRADE
1.0/ 100
METRIC RATING
247th/ 347
METRIC RANK
91.8%
11TH GRADE
3.9/ 100
METRIC RATING
230th/ 347
METRIC RANK
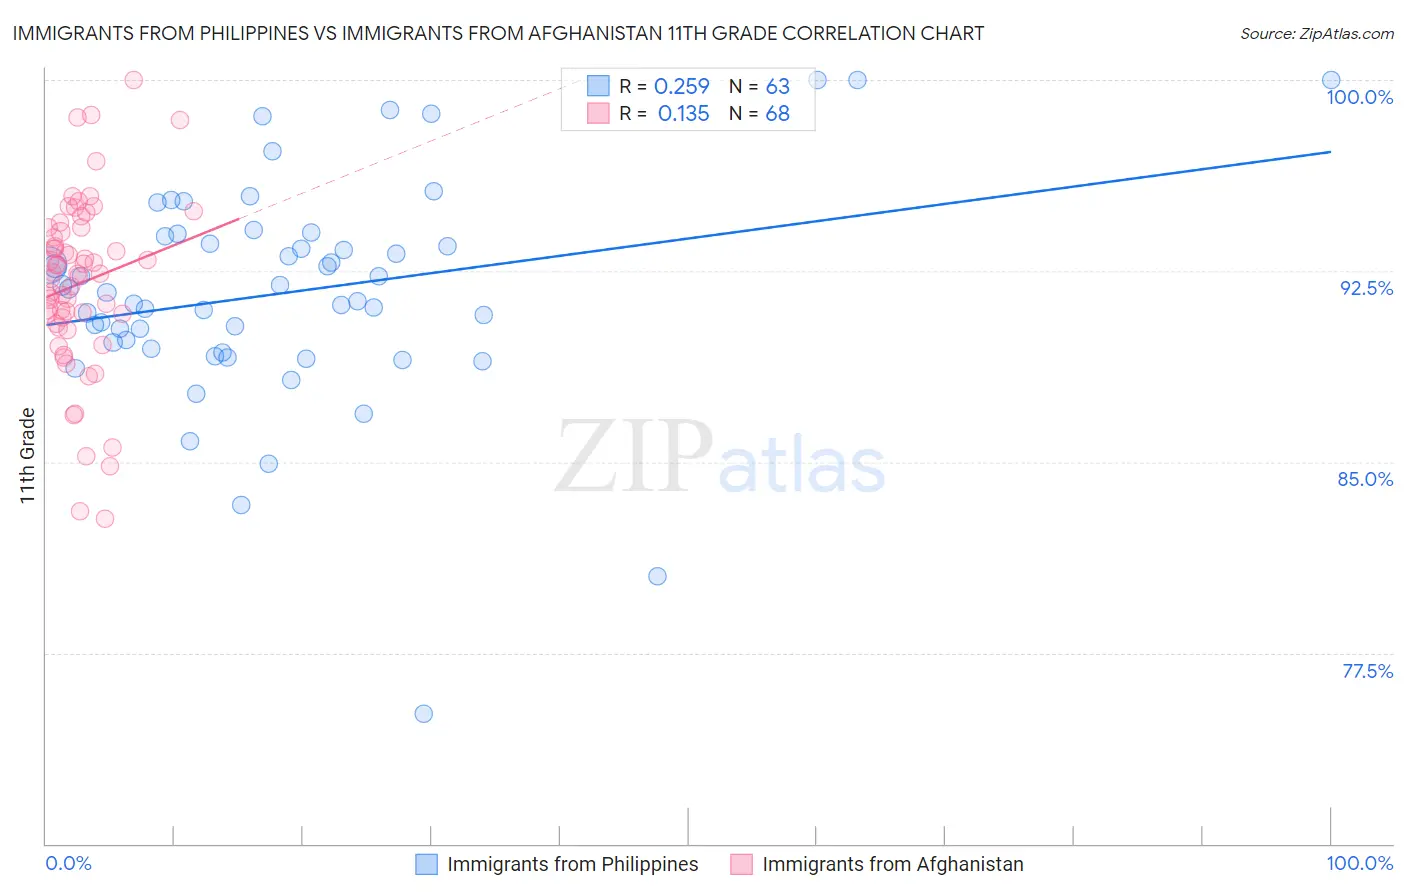
Immigrants from Philippines vs Immigrants from Afghanistan 11th Grade Correlation Chart
The statistical analysis conducted on geographies consisting of 471,300,535 people shows a weak positive correlation between the proportion of Immigrants from Philippines and percentage of population with at least 11th grade education in the United States with a correlation coefficient (R) of 0.259 and weighted average of 91.5%. Similarly, the statistical analysis conducted on geographies consisting of 147,629,924 people shows a poor positive correlation between the proportion of Immigrants from Afghanistan and percentage of population with at least 11th grade education in the United States with a correlation coefficient (R) of 0.135 and weighted average of 91.8%, a difference of 0.35%.
11th Grade Correlation Summary
| Measurement | Immigrants from Philippines | Immigrants from Afghanistan |
| Minimum | 75.1% | 82.8% |
| Maximum | 100.0% | 100.0% |
| Range | 24.9% | 17.2% |
| Mean | 91.6% | 92.0% |
| Median | 91.7% | 92.4% |
| Interquartile 25% (IQ1) | 89.4% | 90.6% |
| Interquartile 75% (IQ3) | 93.9% | 94.1% |
| Interquartile Range (IQR) | 4.4% | 3.6% |
| Standard Deviation (Sample) | 4.3% | 3.4% |
| Standard Deviation (Population) | 4.3% | 3.4% |
Demographics Similar to Immigrants from Philippines and Immigrants from Afghanistan by 11th Grade
In terms of 11th grade, the demographic groups most similar to Immigrants from Philippines are Immigrants from Uzbekistan (91.5%, a difference of 0.0%), Seminole (91.5%, a difference of 0.040%), African (91.5%, a difference of 0.070%), Immigrants from Thailand (91.6%, a difference of 0.090%), and Senegalese (91.6%, a difference of 0.090%). Similarly, the demographic groups most similar to Immigrants from Afghanistan are Choctaw (91.8%, a difference of 0.010%), Immigrants from Panama (91.8%, a difference of 0.030%), Nigerian (91.8%, a difference of 0.030%), Uruguayan (91.8%, a difference of 0.030%), and Cheyenne (91.8%, a difference of 0.040%).
| Demographics | Rating | Rank | 11th Grade |
| Immigrants | Panama | 4.3 /100 | #228 | Tragic 91.8% |
| Nigerians | 4.3 /100 | #229 | Tragic 91.8% |
| Immigrants | Afghanistan | 3.9 /100 | #230 | Tragic 91.8% |
| Choctaw | 3.7 /100 | #231 | Tragic 91.8% |
| Uruguayans | 3.5 /100 | #232 | Tragic 91.8% |
| Cheyenne | 3.3 /100 | #233 | Tragic 91.8% |
| Armenians | 2.9 /100 | #234 | Tragic 91.7% |
| Sub-Saharan Africans | 2.9 /100 | #235 | Tragic 91.7% |
| Colombians | 2.8 /100 | #236 | Tragic 91.7% |
| Immigrants | Bolivia | 2.8 /100 | #237 | Tragic 91.7% |
| Comanche | 2.6 /100 | #238 | Tragic 91.7% |
| Hopi | 2.5 /100 | #239 | Tragic 91.7% |
| South Americans | 2.0 /100 | #240 | Tragic 91.6% |
| Bahamians | 1.8 /100 | #241 | Tragic 91.6% |
| Immigrants | Middle Africa | 1.6 /100 | #242 | Tragic 91.6% |
| Immigrants | Thailand | 1.4 /100 | #243 | Tragic 91.6% |
| Senegalese | 1.4 /100 | #244 | Tragic 91.6% |
| Africans | 1.3 /100 | #245 | Tragic 91.5% |
| Seminole | 1.2 /100 | #246 | Tragic 91.5% |
| Immigrants | Philippines | 1.0 /100 | #247 | Tragic 91.5% |
| Immigrants | Uzbekistan | 1.0 /100 | #248 | Tragic 91.5% |