Basque vs Hmong 11th Grade
COMPARE
Basque
Hmong
11th Grade
11th Grade Comparison
Basques
Hmong
93.2%
11TH GRADE
95.2/ 100
METRIC RATING
126th/ 347
METRIC RANK
92.8%
11TH GRADE
78.6/ 100
METRIC RATING
148th/ 347
METRIC RANK
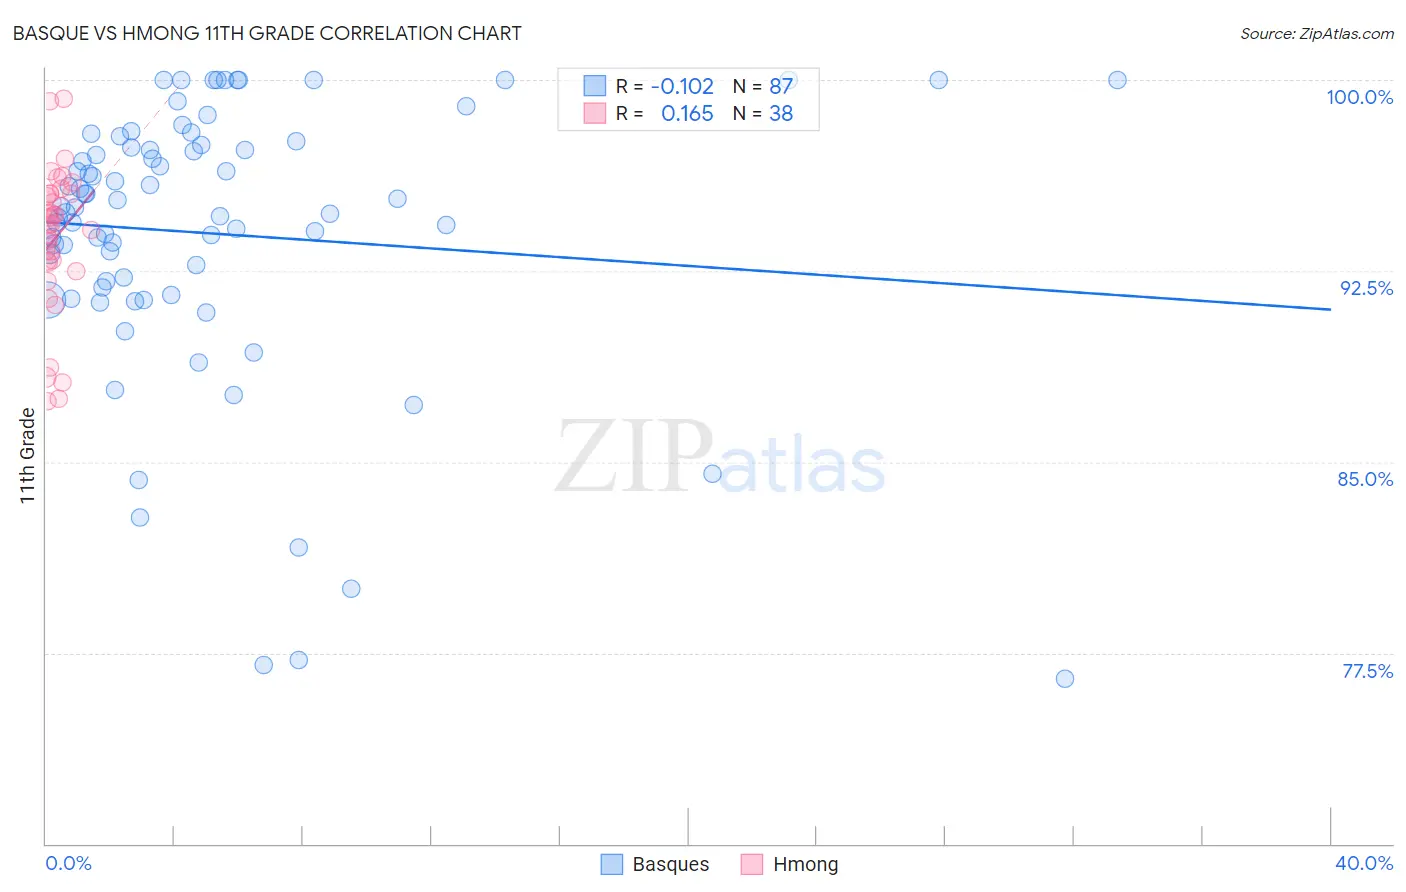
Basque vs Hmong 11th Grade Correlation Chart
The statistical analysis conducted on geographies consisting of 165,777,136 people shows a poor negative correlation between the proportion of Basques and percentage of population with at least 11th grade education in the United States with a correlation coefficient (R) of -0.102 and weighted average of 93.2%. Similarly, the statistical analysis conducted on geographies consisting of 24,672,093 people shows a poor positive correlation between the proportion of Hmong and percentage of population with at least 11th grade education in the United States with a correlation coefficient (R) of 0.165 and weighted average of 92.8%, a difference of 0.41%.
11th Grade Correlation Summary
| Measurement | Basque | Hmong |
| Minimum | 76.5% | 87.4% |
| Maximum | 100.0% | 99.2% |
| Range | 23.5% | 11.9% |
| Mean | 94.0% | 93.8% |
| Median | 95.0% | 94.3% |
| Interquartile 25% (IQ1) | 91.9% | 92.8% |
| Interquartile 75% (IQ3) | 97.5% | 95.5% |
| Interquartile Range (IQR) | 5.6% | 2.7% |
| Standard Deviation (Sample) | 5.4% | 2.9% |
| Standard Deviation (Population) | 5.4% | 2.8% |
Similar Demographics by 11th Grade
Demographics Similar to Basques by 11th Grade
In terms of 11th grade, the demographic groups most similar to Basques are Immigrants from Sri Lanka (93.2%, a difference of 0.020%), Immigrants from Greece (93.2%, a difference of 0.040%), Immigrants from Eastern Europe (93.2%, a difference of 0.040%), German Russian (93.3%, a difference of 0.070%), and Immigrants from Belarus (93.3%, a difference of 0.070%).
| Demographics | Rating | Rank | 11th Grade |
| Israelis | 97.0 /100 | #119 | Exceptional 93.3% |
| Immigrants | Russia | 96.6 /100 | #120 | Exceptional 93.3% |
| German Russians | 96.4 /100 | #121 | Exceptional 93.3% |
| Immigrants | Belarus | 96.3 /100 | #122 | Exceptional 93.3% |
| Immigrants | Greece | 95.9 /100 | #123 | Exceptional 93.2% |
| Immigrants | Eastern Europe | 95.9 /100 | #124 | Exceptional 93.2% |
| Immigrants | Sri Lanka | 95.6 /100 | #125 | Exceptional 93.2% |
| Basques | 95.2 /100 | #126 | Exceptional 93.2% |
| Immigrants | Kazakhstan | 92.4 /100 | #127 | Exceptional 93.1% |
| Immigrants | Jordan | 92.4 /100 | #128 | Exceptional 93.1% |
| Immigrants | Ukraine | 89.8 /100 | #129 | Excellent 93.0% |
| Albanians | 89.5 /100 | #130 | Excellent 93.0% |
| Egyptians | 89.5 /100 | #131 | Excellent 93.0% |
| Immigrants | Bosnia and Herzegovina | 89.0 /100 | #132 | Excellent 93.0% |
| Mongolians | 87.6 /100 | #133 | Excellent 93.0% |
Demographics Similar to Hmong by 11th Grade
In terms of 11th grade, the demographic groups most similar to Hmong are Immigrants from Kenya (92.8%, a difference of 0.0%), Immigrants from Poland (92.8%, a difference of 0.0%), Iroquois (92.8%, a difference of 0.010%), Pakistani (92.8%, a difference of 0.020%), and Immigrants from Egypt (92.8%, a difference of 0.020%).
| Demographics | Rating | Rank | 11th Grade |
| Chileans | 83.0 /100 | #141 | Excellent 92.9% |
| Kenyans | 82.0 /100 | #142 | Excellent 92.9% |
| Ugandans | 81.4 /100 | #143 | Excellent 92.9% |
| Assyrians/Chaldeans/Syriacs | 80.5 /100 | #144 | Excellent 92.8% |
| Pakistanis | 79.6 /100 | #145 | Good 92.8% |
| Iroquois | 79.1 /100 | #146 | Good 92.8% |
| Immigrants | Kenya | 78.7 /100 | #147 | Good 92.8% |
| Hmong | 78.6 /100 | #148 | Good 92.8% |
| Immigrants | Poland | 78.5 /100 | #149 | Good 92.8% |
| Immigrants | Egypt | 77.5 /100 | #150 | Good 92.8% |
| Potawatomi | 74.3 /100 | #151 | Good 92.8% |
| Iraqis | 74.2 /100 | #152 | Good 92.8% |
| Brazilians | 73.9 /100 | #153 | Good 92.8% |
| Osage | 73.4 /100 | #154 | Good 92.7% |
| Argentineans | 73.4 /100 | #155 | Good 92.7% |