Immigrants from Cuba vs Immigrants from Afghanistan 11th Grade
COMPARE
Immigrants from Cuba
Immigrants from Afghanistan
11th Grade
11th Grade Comparison
Immigrants from Cuba
Immigrants from Afghanistan
88.9%
11TH GRADE
0.0/ 100
METRIC RATING
316th/ 347
METRIC RANK
91.8%
11TH GRADE
3.9/ 100
METRIC RATING
230th/ 347
METRIC RANK
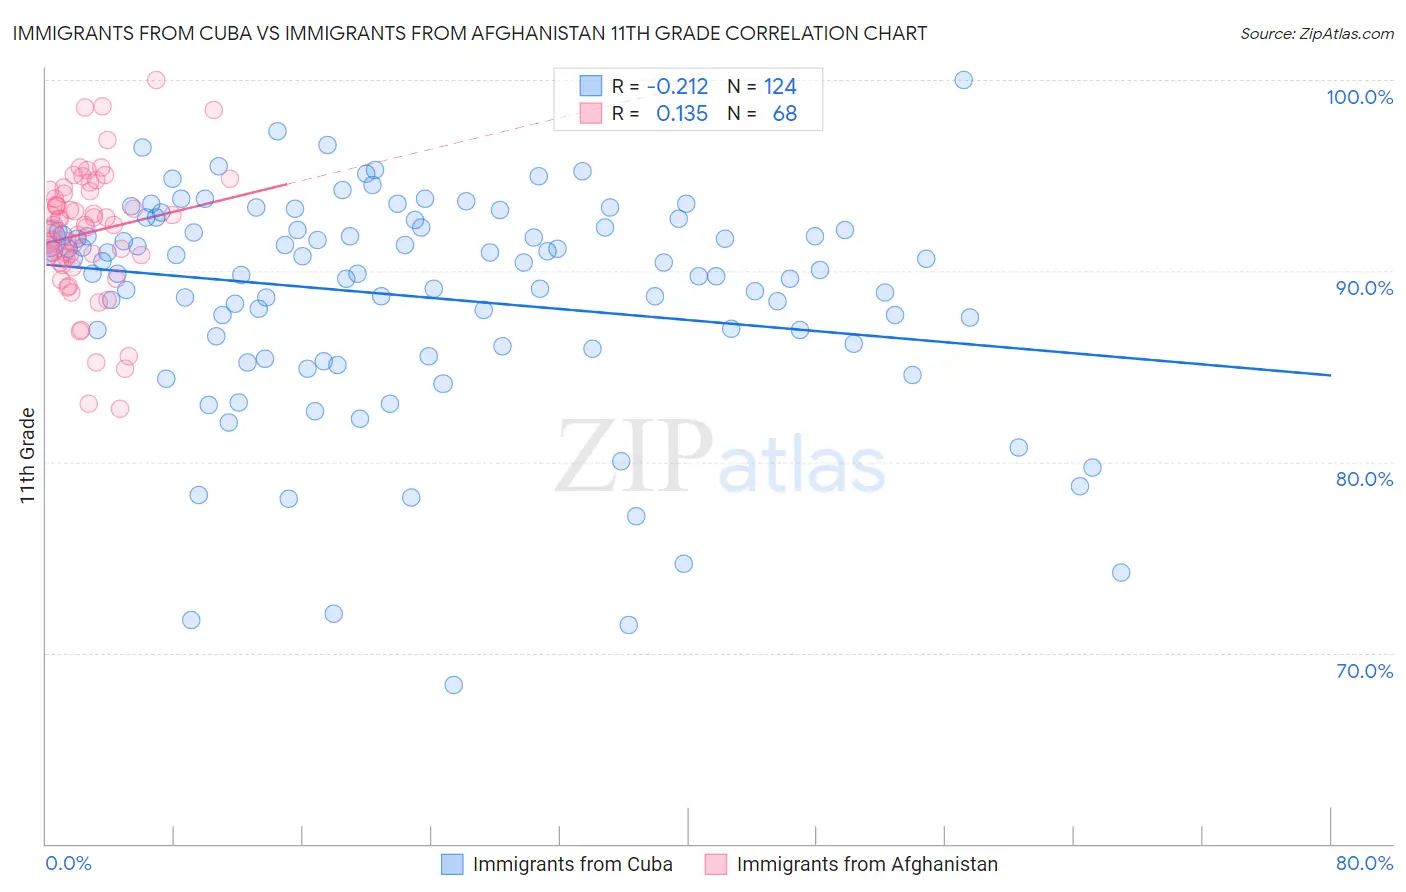
Immigrants from Cuba vs Immigrants from Afghanistan 11th Grade Correlation Chart
The statistical analysis conducted on geographies consisting of 326,028,015 people shows a weak negative correlation between the proportion of Immigrants from Cuba and percentage of population with at least 11th grade education in the United States with a correlation coefficient (R) of -0.212 and weighted average of 88.9%. Similarly, the statistical analysis conducted on geographies consisting of 147,629,924 people shows a poor positive correlation between the proportion of Immigrants from Afghanistan and percentage of population with at least 11th grade education in the United States with a correlation coefficient (R) of 0.135 and weighted average of 91.8%, a difference of 3.2%.
11th Grade Correlation Summary
| Measurement | Immigrants from Cuba | Immigrants from Afghanistan |
| Minimum | 68.3% | 82.8% |
| Maximum | 100.0% | 100.0% |
| Range | 31.7% | 17.2% |
| Mean | 88.7% | 92.0% |
| Median | 90.2% | 92.4% |
| Interquartile 25% (IQ1) | 86.1% | 90.6% |
| Interquartile 75% (IQ3) | 92.2% | 94.1% |
| Interquartile Range (IQR) | 6.1% | 3.6% |
| Standard Deviation (Sample) | 5.8% | 3.4% |
| Standard Deviation (Population) | 5.8% | 3.4% |
Similar Demographics by 11th Grade
Demographics Similar to Immigrants from Cuba by 11th Grade
In terms of 11th grade, the demographic groups most similar to Immigrants from Cuba are Lumbee (88.9%, a difference of 0.010%), Nicaraguan (88.9%, a difference of 0.070%), Immigrants from Ecuador (89.1%, a difference of 0.15%), Cape Verdean (89.1%, a difference of 0.16%), and Belizean (88.8%, a difference of 0.16%).
| Demographics | Rating | Rank | 11th Grade |
| Immigrants | Bangladesh | 0.0 /100 | #309 | Tragic 89.5% |
| Yaqui | 0.0 /100 | #310 | Tragic 89.5% |
| Vietnamese | 0.0 /100 | #311 | Tragic 89.4% |
| Immigrants | Portugal | 0.0 /100 | #312 | Tragic 89.3% |
| Immigrants | Caribbean | 0.0 /100 | #313 | Tragic 89.1% |
| Cape Verdeans | 0.0 /100 | #314 | Tragic 89.1% |
| Immigrants | Ecuador | 0.0 /100 | #315 | Tragic 89.1% |
| Immigrants | Cuba | 0.0 /100 | #316 | Tragic 88.9% |
| Lumbee | 0.0 /100 | #317 | Tragic 88.9% |
| Nicaraguans | 0.0 /100 | #318 | Tragic 88.9% |
| Belizeans | 0.0 /100 | #319 | Tragic 88.8% |
| Immigrants | Armenia | 0.0 /100 | #320 | Tragic 88.8% |
| Immigrants | Belize | 0.0 /100 | #321 | Tragic 88.7% |
| Puerto Ricans | 0.0 /100 | #322 | Tragic 88.4% |
| Pima | 0.0 /100 | #323 | Tragic 88.3% |
Demographics Similar to Immigrants from Afghanistan by 11th Grade
In terms of 11th grade, the demographic groups most similar to Immigrants from Afghanistan are Choctaw (91.8%, a difference of 0.010%), Immigrants from Cameroon (91.8%, a difference of 0.030%), Immigrants from Panama (91.8%, a difference of 0.030%), Nigerian (91.8%, a difference of 0.030%), and Uruguayan (91.8%, a difference of 0.030%).
| Demographics | Rating | Rank | 11th Grade |
| Immigrants | Bahamas | 6.5 /100 | #223 | Tragic 91.9% |
| Costa Ricans | 6.3 /100 | #224 | Tragic 91.9% |
| Immigrants | Zaire | 5.4 /100 | #225 | Tragic 91.9% |
| Immigrants | Somalia | 5.2 /100 | #226 | Tragic 91.9% |
| Immigrants | Cameroon | 4.4 /100 | #227 | Tragic 91.8% |
| Immigrants | Panama | 4.3 /100 | #228 | Tragic 91.8% |
| Nigerians | 4.3 /100 | #229 | Tragic 91.8% |
| Immigrants | Afghanistan | 3.9 /100 | #230 | Tragic 91.8% |
| Choctaw | 3.7 /100 | #231 | Tragic 91.8% |
| Uruguayans | 3.5 /100 | #232 | Tragic 91.8% |
| Cheyenne | 3.3 /100 | #233 | Tragic 91.8% |
| Armenians | 2.9 /100 | #234 | Tragic 91.7% |
| Sub-Saharan Africans | 2.9 /100 | #235 | Tragic 91.7% |
| Colombians | 2.8 /100 | #236 | Tragic 91.7% |
| Immigrants | Bolivia | 2.8 /100 | #237 | Tragic 91.7% |