Barbadian vs Immigrants from Uzbekistan 10th Grade
COMPARE
Barbadian
Immigrants from Uzbekistan
10th Grade
10th Grade Comparison
Barbadians
Immigrants from Uzbekistan
92.2%
10TH GRADE
0.1/ 100
METRIC RATING
278th/ 347
METRIC RANK
92.6%
10TH GRADE
0.5/ 100
METRIC RATING
260th/ 347
METRIC RANK
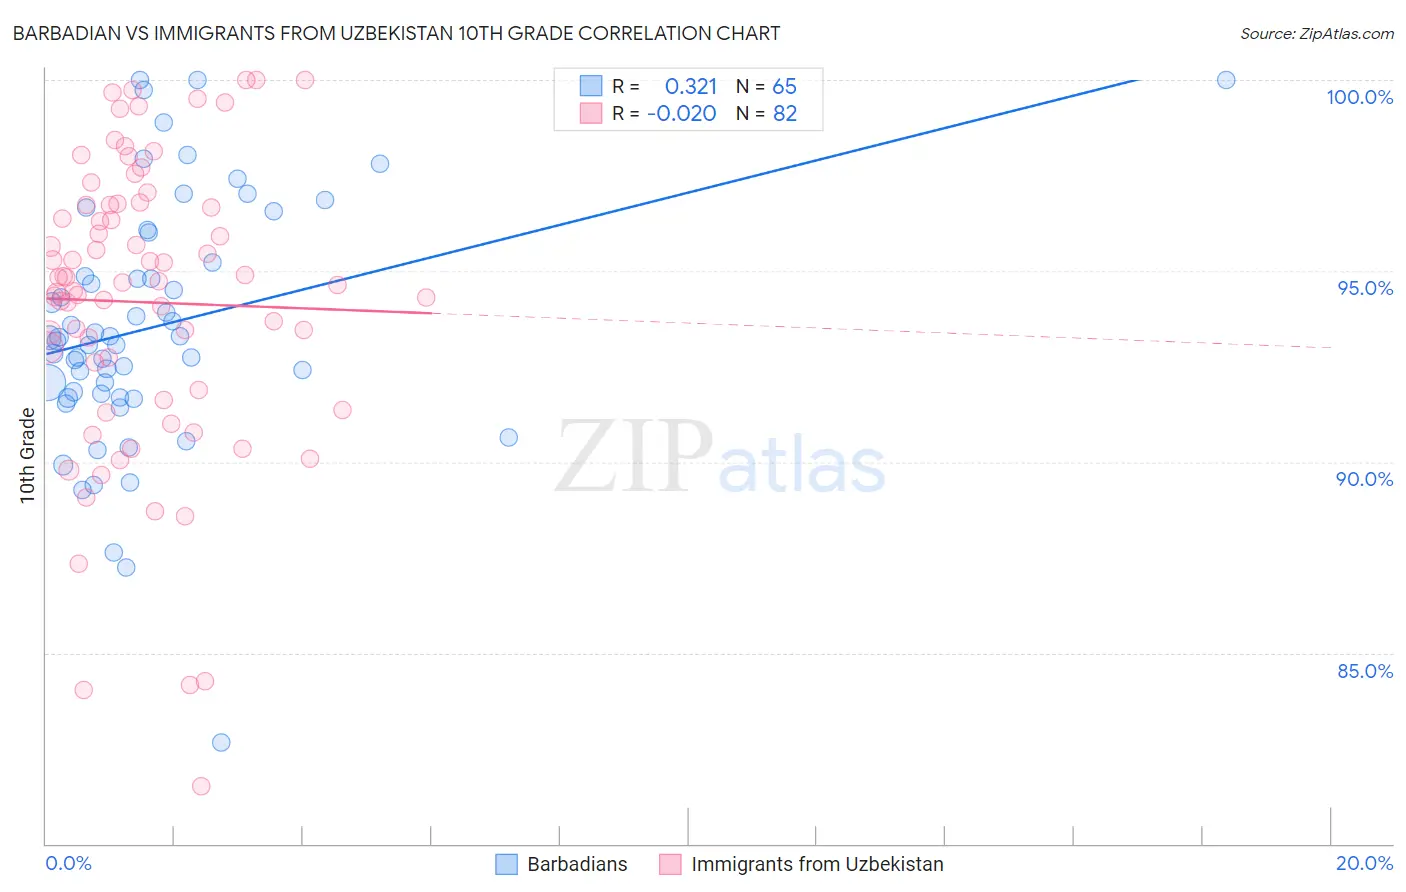
Barbadian vs Immigrants from Uzbekistan 10th Grade Correlation Chart
The statistical analysis conducted on geographies consisting of 141,299,083 people shows a mild positive correlation between the proportion of Barbadians and percentage of population with at least 10th grade education in the United States with a correlation coefficient (R) of 0.321 and weighted average of 92.2%. Similarly, the statistical analysis conducted on geographies consisting of 118,684,730 people shows no correlation between the proportion of Immigrants from Uzbekistan and percentage of population with at least 10th grade education in the United States with a correlation coefficient (R) of -0.020 and weighted average of 92.6%, a difference of 0.44%.
10th Grade Correlation Summary
| Measurement | Barbadian | Immigrants from Uzbekistan |
| Minimum | 82.6% | 81.5% |
| Maximum | 100.0% | 100.0% |
| Range | 17.4% | 18.5% |
| Mean | 93.5% | 94.2% |
| Median | 93.3% | 94.7% |
| Interquartile 25% (IQ1) | 91.7% | 91.9% |
| Interquartile 75% (IQ3) | 95.6% | 96.7% |
| Interquartile Range (IQR) | 3.9% | 4.8% |
| Standard Deviation (Sample) | 3.3% | 3.9% |
| Standard Deviation (Population) | 3.2% | 3.9% |
Demographics Similar to Barbadians and Immigrants from Uzbekistan by 10th Grade
In terms of 10th grade, the demographic groups most similar to Barbadians are Native/Alaskan (92.2%, a difference of 0.010%), Navajo (92.3%, a difference of 0.040%), Immigrants from Trinidad and Tobago (92.3%, a difference of 0.11%), West Indian (92.4%, a difference of 0.23%), and Trinidadian and Tobagonian (92.4%, a difference of 0.24%). Similarly, the demographic groups most similar to Immigrants from Uzbekistan are Immigrants from Jamaica (92.6%, a difference of 0.010%), Paiute (92.6%, a difference of 0.040%), Immigrants from South America (92.6%, a difference of 0.050%), Apache (92.6%, a difference of 0.050%), and Peruvian (92.6%, a difference of 0.050%).
| Demographics | Rating | Rank | 10th Grade |
| Immigrants | Jamaica | 0.5 /100 | #259 | Tragic 92.6% |
| Immigrants | Uzbekistan | 0.5 /100 | #260 | Tragic 92.6% |
| Paiute | 0.4 /100 | #261 | Tragic 92.6% |
| Immigrants | South America | 0.4 /100 | #262 | Tragic 92.6% |
| Apache | 0.4 /100 | #263 | Tragic 92.6% |
| Peruvians | 0.4 /100 | #264 | Tragic 92.6% |
| Dutch West Indians | 0.4 /100 | #265 | Tragic 92.6% |
| Immigrants | Philippines | 0.4 /100 | #266 | Tragic 92.6% |
| Taiwanese | 0.3 /100 | #267 | Tragic 92.5% |
| Immigrants | Ghana | 0.3 /100 | #268 | Tragic 92.5% |
| Immigrants | Colombia | 0.3 /100 | #269 | Tragic 92.5% |
| Immigrants | Uruguay | 0.3 /100 | #270 | Tragic 92.5% |
| Immigrants | Eritrea | 0.3 /100 | #271 | Tragic 92.5% |
| Immigrants | Western Africa | 0.3 /100 | #272 | Tragic 92.5% |
| Trinidadians and Tobagonians | 0.2 /100 | #273 | Tragic 92.4% |
| Immigrants | Congo | 0.2 /100 | #274 | Tragic 92.4% |
| West Indians | 0.2 /100 | #275 | Tragic 92.4% |
| Immigrants | Trinidad and Tobago | 0.1 /100 | #276 | Tragic 92.3% |
| Navajo | 0.1 /100 | #277 | Tragic 92.3% |
| Barbadians | 0.1 /100 | #278 | Tragic 92.2% |
| Natives/Alaskans | 0.1 /100 | #279 | Tragic 92.2% |