Barbadian vs Immigrants from Lithuania 10th Grade
COMPARE
Barbadian
Immigrants from Lithuania
10th Grade
10th Grade Comparison
Barbadians
Immigrants from Lithuania
92.2%
10TH GRADE
0.1/ 100
METRIC RATING
278th/ 347
METRIC RANK
95.0%
10TH GRADE
99.8/ 100
METRIC RATING
54th/ 347
METRIC RANK
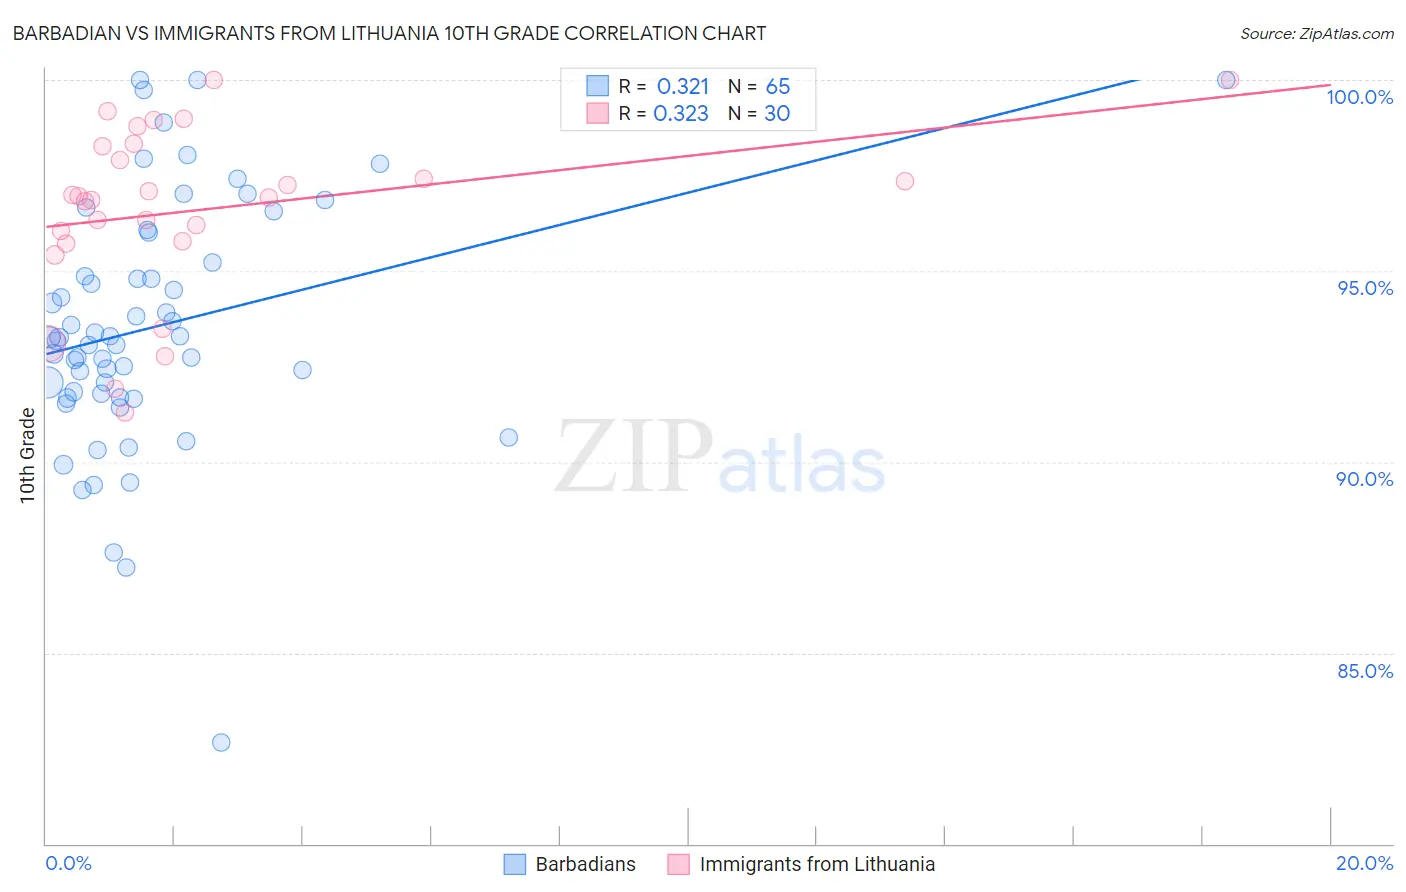
Barbadian vs Immigrants from Lithuania 10th Grade Correlation Chart
The statistical analysis conducted on geographies consisting of 141,299,083 people shows a mild positive correlation between the proportion of Barbadians and percentage of population with at least 10th grade education in the United States with a correlation coefficient (R) of 0.321 and weighted average of 92.2%. Similarly, the statistical analysis conducted on geographies consisting of 117,724,932 people shows a mild positive correlation between the proportion of Immigrants from Lithuania and percentage of population with at least 10th grade education in the United States with a correlation coefficient (R) of 0.323 and weighted average of 95.0%, a difference of 3.0%.
10th Grade Correlation Summary
| Measurement | Barbadian | Immigrants from Lithuania |
| Minimum | 82.6% | 91.3% |
| Maximum | 100.0% | 100.0% |
| Range | 17.4% | 8.7% |
| Mean | 93.5% | 96.6% |
| Median | 93.3% | 96.9% |
| Interquartile 25% (IQ1) | 91.7% | 95.8% |
| Interquartile 75% (IQ3) | 95.6% | 98.3% |
| Interquartile Range (IQR) | 3.9% | 2.5% |
| Standard Deviation (Sample) | 3.3% | 2.2% |
| Standard Deviation (Population) | 3.2% | 2.2% |
Similar Demographics by 10th Grade
Demographics Similar to Barbadians by 10th Grade
In terms of 10th grade, the demographic groups most similar to Barbadians are Native/Alaskan (92.2%, a difference of 0.010%), Navajo (92.3%, a difference of 0.040%), Malaysian (92.2%, a difference of 0.040%), Bangladeshi (92.2%, a difference of 0.040%), and Immigrants from Peru (92.2%, a difference of 0.060%).
| Demographics | Rating | Rank | 10th Grade |
| Immigrants | Eritrea | 0.3 /100 | #271 | Tragic 92.5% |
| Immigrants | Western Africa | 0.3 /100 | #272 | Tragic 92.5% |
| Trinidadians and Tobagonians | 0.2 /100 | #273 | Tragic 92.4% |
| Immigrants | Congo | 0.2 /100 | #274 | Tragic 92.4% |
| West Indians | 0.2 /100 | #275 | Tragic 92.4% |
| Immigrants | Trinidad and Tobago | 0.1 /100 | #276 | Tragic 92.3% |
| Navajo | 0.1 /100 | #277 | Tragic 92.3% |
| Barbadians | 0.1 /100 | #278 | Tragic 92.2% |
| Natives/Alaskans | 0.1 /100 | #279 | Tragic 92.2% |
| Malaysians | 0.1 /100 | #280 | Tragic 92.2% |
| Bangladeshis | 0.1 /100 | #281 | Tragic 92.2% |
| Immigrants | Peru | 0.1 /100 | #282 | Tragic 92.2% |
| Immigrants | St. Vincent and the Grenadines | 0.0 /100 | #283 | Tragic 92.1% |
| Immigrants | Barbados | 0.0 /100 | #284 | Tragic 92.1% |
| Immigrants | South Eastern Asia | 0.0 /100 | #285 | Tragic 92.1% |
Demographics Similar to Immigrants from Lithuania by 10th Grade
In terms of 10th grade, the demographic groups most similar to Immigrants from Lithuania are Immigrants from Ireland (95.0%, a difference of 0.010%), Immigrants from North America (95.0%, a difference of 0.020%), New Zealander (95.0%, a difference of 0.020%), Ukrainian (95.0%, a difference of 0.020%), and Aleut (95.0%, a difference of 0.020%).
| Demographics | Rating | Rank | 10th Grade |
| Serbians | 99.9 /100 | #47 | Exceptional 95.1% |
| Australians | 99.9 /100 | #48 | Exceptional 95.1% |
| Immigrants | Austria | 99.9 /100 | #49 | Exceptional 95.1% |
| Immigrants | Canada | 99.8 /100 | #50 | Exceptional 95.1% |
| Austrians | 99.8 /100 | #51 | Exceptional 95.1% |
| Ottawa | 99.8 /100 | #52 | Exceptional 95.1% |
| Immigrants | North America | 99.8 /100 | #53 | Exceptional 95.0% |
| Immigrants | Lithuania | 99.8 /100 | #54 | Exceptional 95.0% |
| Immigrants | Ireland | 99.8 /100 | #55 | Exceptional 95.0% |
| New Zealanders | 99.8 /100 | #56 | Exceptional 95.0% |
| Ukrainians | 99.8 /100 | #57 | Exceptional 95.0% |
| Aleuts | 99.8 /100 | #58 | Exceptional 95.0% |
| Celtics | 99.8 /100 | #59 | Exceptional 95.0% |
| Cypriots | 99.8 /100 | #60 | Exceptional 95.0% |
| Chippewa | 99.8 /100 | #61 | Exceptional 95.0% |