Barbadian vs Immigrants from Micronesia Unemployment Among Ages 60 to 64 years
COMPARE
Barbadian
Immigrants from Micronesia
Unemployment Among Ages 60 to 64 years
Unemployment Among Ages 60 to 64 years Comparison
Barbadians
Immigrants from Micronesia
5.4%
UNEMPLOYMENT AMONG AGES 60 TO 64 YEARS
0.0/ 100
METRIC RATING
302nd/ 347
METRIC RANK
4.2%
UNEMPLOYMENT AMONG AGES 60 TO 64 YEARS
100.0/ 100
METRIC RATING
8th/ 347
METRIC RANK
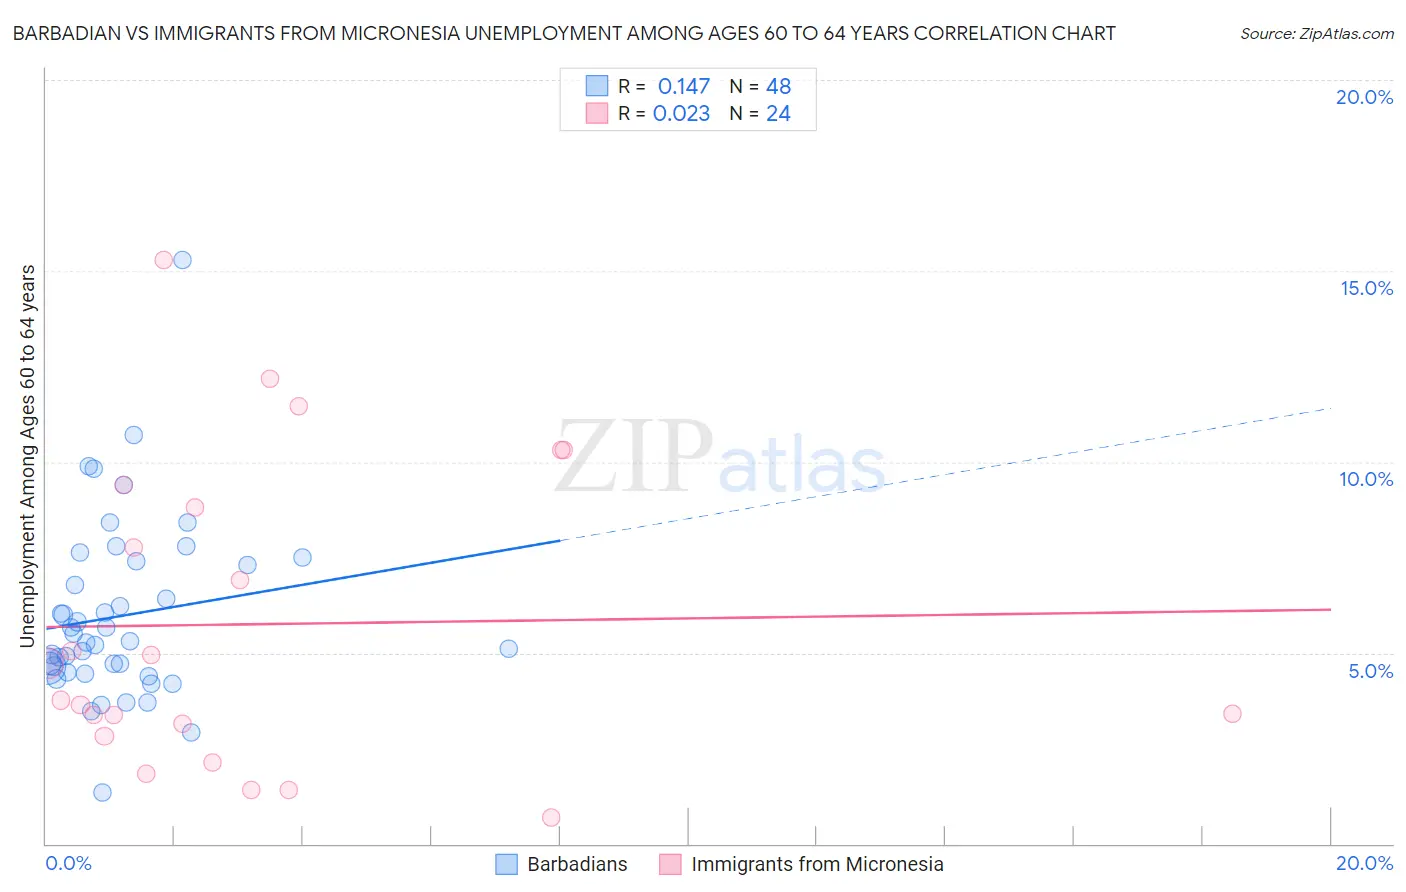
Barbadian vs Immigrants from Micronesia Unemployment Among Ages 60 to 64 years Correlation Chart
The statistical analysis conducted on geographies consisting of 136,407,444 people shows a poor positive correlation between the proportion of Barbadians and unemployment rate among population between the ages 60 and 64 in the United States with a correlation coefficient (R) of 0.147 and weighted average of 5.4%. Similarly, the statistical analysis conducted on geographies consisting of 59,497,653 people shows no correlation between the proportion of Immigrants from Micronesia and unemployment rate among population between the ages 60 and 64 in the United States with a correlation coefficient (R) of 0.023 and weighted average of 4.2%, a difference of 27.9%.
Unemployment Among Ages 60 to 64 years Correlation Summary
| Measurement | Barbadian | Immigrants from Micronesia |
| Minimum | 1.3% | 0.70% |
| Maximum | 15.3% | 15.3% |
| Range | 13.9% | 14.6% |
| Mean | 6.0% | 5.8% |
| Median | 5.3% | 4.2% |
| Interquartile 25% (IQ1) | 4.6% | 3.0% |
| Interquartile 75% (IQ3) | 7.3% | 9.1% |
| Interquartile Range (IQR) | 2.8% | 6.1% |
| Standard Deviation (Sample) | 2.4% | 4.0% |
| Standard Deviation (Population) | 2.3% | 3.9% |
Similar Demographics by Unemployment Among Ages 60 to 64 years
Demographics Similar to Barbadians by Unemployment Among Ages 60 to 64 years
In terms of unemployment among ages 60 to 64 years, the demographic groups most similar to Barbadians are Bahamian (5.4%, a difference of 0.10%), Immigrants from Mexico (5.4%, a difference of 0.14%), Cypriot (5.4%, a difference of 0.16%), Immigrants from Dominica (5.4%, a difference of 0.24%), and Immigrants from Jamaica (5.4%, a difference of 0.40%).
| Demographics | Rating | Rank | Unemployment Among Ages 60 to 64 years |
| Armenians | 0.0 /100 | #295 | Tragic 5.3% |
| Jamaicans | 0.0 /100 | #296 | Tragic 5.3% |
| Osage | 0.0 /100 | #297 | Tragic 5.4% |
| Immigrants | Central America | 0.0 /100 | #298 | Tragic 5.4% |
| Immigrants | El Salvador | 0.0 /100 | #299 | Tragic 5.4% |
| Immigrants | Barbados | 0.0 /100 | #300 | Tragic 5.4% |
| Immigrants | Jamaica | 0.0 /100 | #301 | Tragic 5.4% |
| Barbadians | 0.0 /100 | #302 | Tragic 5.4% |
| Bahamians | 0.0 /100 | #303 | Tragic 5.4% |
| Immigrants | Mexico | 0.0 /100 | #304 | Tragic 5.4% |
| Cypriots | 0.0 /100 | #305 | Tragic 5.4% |
| Immigrants | Dominica | 0.0 /100 | #306 | Tragic 5.4% |
| Immigrants | Guyana | 0.0 /100 | #307 | Tragic 5.4% |
| Spanish American Indians | 0.0 /100 | #308 | Tragic 5.4% |
| Soviet Union | 0.0 /100 | #309 | Tragic 5.4% |
Demographics Similar to Immigrants from Micronesia by Unemployment Among Ages 60 to 64 years
In terms of unemployment among ages 60 to 64 years, the demographic groups most similar to Immigrants from Micronesia are Indonesian (4.2%, a difference of 0.51%), Immigrants from Bosnia and Herzegovina (4.2%, a difference of 0.87%), Lumbee (4.2%, a difference of 1.1%), Luxembourger (4.3%, a difference of 1.6%), and Immigrants from Congo (4.1%, a difference of 2.1%).
| Demographics | Rating | Rank | Unemployment Among Ages 60 to 64 years |
| Marshallese | 100.0 /100 | #1 | Exceptional 3.7% |
| Fijians | 100.0 /100 | #2 | Exceptional 3.9% |
| Chinese | 100.0 /100 | #3 | Exceptional 4.0% |
| Hmong | 100.0 /100 | #4 | Exceptional 4.0% |
| Immigrants | Azores | 100.0 /100 | #5 | Exceptional 4.0% |
| Immigrants | Congo | 100.0 /100 | #6 | Exceptional 4.1% |
| Lumbee | 100.0 /100 | #7 | Exceptional 4.2% |
| Immigrants | Micronesia | 100.0 /100 | #8 | Exceptional 4.2% |
| Indonesians | 100.0 /100 | #9 | Exceptional 4.2% |
| Immigrants | Bosnia and Herzegovina | 100.0 /100 | #10 | Exceptional 4.2% |
| Luxembourgers | 100.0 /100 | #11 | Exceptional 4.3% |
| Immigrants | Cuba | 100.0 /100 | #12 | Exceptional 4.3% |
| Chickasaw | 100.0 /100 | #13 | Exceptional 4.3% |
| Norwegians | 100.0 /100 | #14 | Exceptional 4.3% |
| Sudanese | 100.0 /100 | #15 | Exceptional 4.3% |