Barbadian vs English 10th Grade
COMPARE
Barbadian
English
10th Grade
10th Grade Comparison
Barbadians
English
92.2%
10TH GRADE
0.1/ 100
METRIC RATING
278th/ 347
METRIC RANK
95.6%
10TH GRADE
100.0/ 100
METRIC RATING
13th/ 347
METRIC RANK
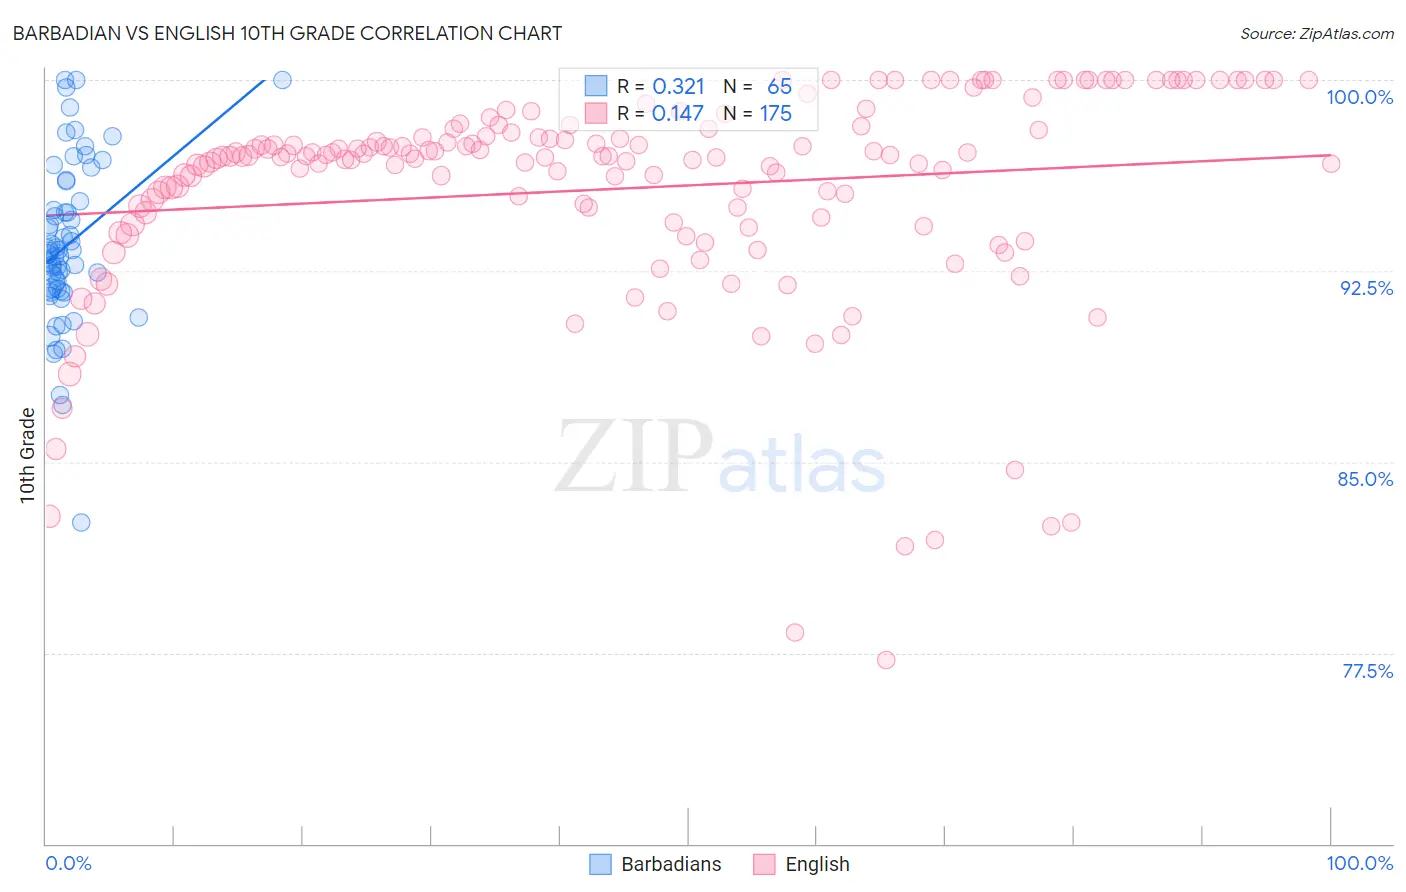
Barbadian vs English 10th Grade Correlation Chart
The statistical analysis conducted on geographies consisting of 141,299,083 people shows a mild positive correlation between the proportion of Barbadians and percentage of population with at least 10th grade education in the United States with a correlation coefficient (R) of 0.321 and weighted average of 92.2%. Similarly, the statistical analysis conducted on geographies consisting of 579,981,136 people shows a poor positive correlation between the proportion of English and percentage of population with at least 10th grade education in the United States with a correlation coefficient (R) of 0.147 and weighted average of 95.6%, a difference of 3.7%.
10th Grade Correlation Summary
| Measurement | Barbadian | English |
| Minimum | 82.6% | 77.2% |
| Maximum | 100.0% | 100.0% |
| Range | 17.4% | 22.8% |
| Mean | 93.5% | 95.7% |
| Median | 93.3% | 97.0% |
| Interquartile 25% (IQ1) | 91.7% | 94.4% |
| Interquartile 75% (IQ3) | 95.6% | 98.1% |
| Interquartile Range (IQR) | 3.9% | 3.7% |
| Standard Deviation (Sample) | 3.3% | 4.3% |
| Standard Deviation (Population) | 3.2% | 4.3% |
Similar Demographics by 10th Grade
Demographics Similar to Barbadians by 10th Grade
In terms of 10th grade, the demographic groups most similar to Barbadians are Native/Alaskan (92.2%, a difference of 0.010%), Navajo (92.3%, a difference of 0.040%), Malaysian (92.2%, a difference of 0.040%), Bangladeshi (92.2%, a difference of 0.040%), and Immigrants from Peru (92.2%, a difference of 0.060%).
| Demographics | Rating | Rank | 10th Grade |
| Immigrants | Eritrea | 0.3 /100 | #271 | Tragic 92.5% |
| Immigrants | Western Africa | 0.3 /100 | #272 | Tragic 92.5% |
| Trinidadians and Tobagonians | 0.2 /100 | #273 | Tragic 92.4% |
| Immigrants | Congo | 0.2 /100 | #274 | Tragic 92.4% |
| West Indians | 0.2 /100 | #275 | Tragic 92.4% |
| Immigrants | Trinidad and Tobago | 0.1 /100 | #276 | Tragic 92.3% |
| Navajo | 0.1 /100 | #277 | Tragic 92.3% |
| Barbadians | 0.1 /100 | #278 | Tragic 92.2% |
| Natives/Alaskans | 0.1 /100 | #279 | Tragic 92.2% |
| Malaysians | 0.1 /100 | #280 | Tragic 92.2% |
| Bangladeshis | 0.1 /100 | #281 | Tragic 92.2% |
| Immigrants | Peru | 0.1 /100 | #282 | Tragic 92.2% |
| Immigrants | St. Vincent and the Grenadines | 0.0 /100 | #283 | Tragic 92.1% |
| Immigrants | Barbados | 0.0 /100 | #284 | Tragic 92.1% |
| Immigrants | South Eastern Asia | 0.0 /100 | #285 | Tragic 92.1% |
Demographics Similar to English by 10th Grade
In terms of 10th grade, the demographic groups most similar to English are Tsimshian (95.6%, a difference of 0.010%), Irish (95.6%, a difference of 0.030%), Tlingit-Haida (95.7%, a difference of 0.040%), Scottish (95.6%, a difference of 0.040%), and Latvian (95.6%, a difference of 0.050%).
| Demographics | Rating | Rank | 10th Grade |
| Poles | 100.0 /100 | #6 | Exceptional 95.8% |
| Germans | 100.0 /100 | #7 | Exceptional 95.8% |
| Lithuanians | 100.0 /100 | #8 | Exceptional 95.8% |
| Finns | 100.0 /100 | #9 | Exceptional 95.8% |
| Croatians | 100.0 /100 | #10 | Exceptional 95.7% |
| Danes | 100.0 /100 | #11 | Exceptional 95.7% |
| Tlingit-Haida | 100.0 /100 | #12 | Exceptional 95.7% |
| English | 100.0 /100 | #13 | Exceptional 95.6% |
| Tsimshian | 100.0 /100 | #14 | Exceptional 95.6% |
| Irish | 100.0 /100 | #15 | Exceptional 95.6% |
| Scottish | 100.0 /100 | #16 | Exceptional 95.6% |
| Latvians | 100.0 /100 | #17 | Exceptional 95.6% |
| Italians | 100.0 /100 | #18 | Exceptional 95.6% |
| Scandinavians | 100.0 /100 | #19 | Exceptional 95.6% |
| Chinese | 100.0 /100 | #20 | Exceptional 95.5% |