Barbadian vs Immigrants from Lithuania Ambulatory Disability
COMPARE
Barbadian
Immigrants from Lithuania
Ambulatory Disability
Ambulatory Disability Comparison
Barbadians
Immigrants from Lithuania
6.8%
AMBULATORY DISABILITY
0.0/ 100
METRIC RATING
282nd/ 347
METRIC RANK
5.6%
AMBULATORY DISABILITY
99.8/ 100
METRIC RATING
60th/ 347
METRIC RANK
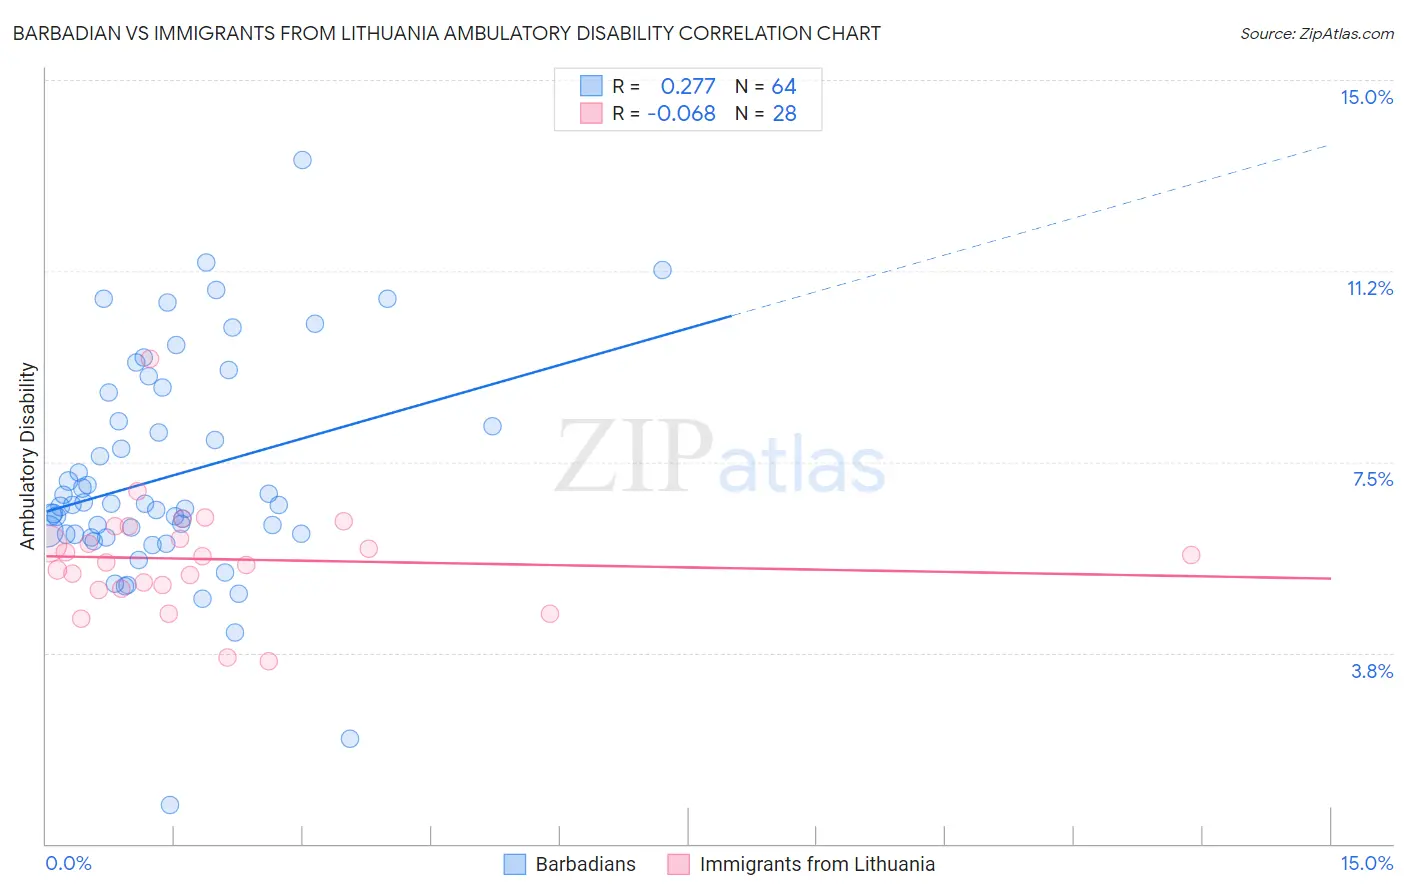
Barbadian vs Immigrants from Lithuania Ambulatory Disability Correlation Chart
The statistical analysis conducted on geographies consisting of 141,286,079 people shows a weak positive correlation between the proportion of Barbadians and percentage of population with ambulatory disability in the United States with a correlation coefficient (R) of 0.277 and weighted average of 6.8%. Similarly, the statistical analysis conducted on geographies consisting of 117,713,012 people shows a slight negative correlation between the proportion of Immigrants from Lithuania and percentage of population with ambulatory disability in the United States with a correlation coefficient (R) of -0.068 and weighted average of 5.6%, a difference of 20.1%.
Ambulatory Disability Correlation Summary
| Measurement | Barbadian | Immigrants from Lithuania |
| Minimum | 0.77% | 3.6% |
| Maximum | 13.4% | 9.5% |
| Range | 12.7% | 5.9% |
| Mean | 7.2% | 5.6% |
| Median | 6.7% | 5.6% |
| Interquartile 25% (IQ1) | 6.1% | 5.0% |
| Interquartile 75% (IQ3) | 8.6% | 6.1% |
| Interquartile Range (IQR) | 2.5% | 1.1% |
| Standard Deviation (Sample) | 2.2% | 1.1% |
| Standard Deviation (Population) | 2.2% | 1.1% |
Similar Demographics by Ambulatory Disability
Demographics Similar to Barbadians by Ambulatory Disability
In terms of ambulatory disability, the demographic groups most similar to Barbadians are Yaqui (6.8%, a difference of 0.13%), Immigrants from Barbados (6.8%, a difference of 0.16%), Pennsylvania German (6.8%, a difference of 0.20%), Immigrants from Jamaica (6.8%, a difference of 0.23%), and Immigrants from Caribbean (6.7%, a difference of 0.30%).
| Demographics | Rating | Rank | Ambulatory Disability |
| Immigrants | Guyana | 0.1 /100 | #275 | Tragic 6.7% |
| Celtics | 0.1 /100 | #276 | Tragic 6.7% |
| Jamaicans | 0.1 /100 | #277 | Tragic 6.7% |
| Immigrants | West Indies | 0.1 /100 | #278 | Tragic 6.7% |
| Immigrants | Caribbean | 0.0 /100 | #279 | Tragic 6.7% |
| Pennsylvania Germans | 0.0 /100 | #280 | Tragic 6.8% |
| Yaqui | 0.0 /100 | #281 | Tragic 6.8% |
| Barbadians | 0.0 /100 | #282 | Tragic 6.8% |
| Immigrants | Barbados | 0.0 /100 | #283 | Tragic 6.8% |
| Immigrants | Jamaica | 0.0 /100 | #284 | Tragic 6.8% |
| Fijians | 0.0 /100 | #285 | Tragic 6.8% |
| Yakama | 0.0 /100 | #286 | Tragic 6.8% |
| U.S. Virgin Islanders | 0.0 /100 | #287 | Tragic 6.8% |
| Immigrants | Nonimmigrants | 0.0 /100 | #288 | Tragic 6.9% |
| Immigrants | Dominica | 0.0 /100 | #289 | Tragic 6.9% |
Demographics Similar to Immigrants from Lithuania by Ambulatory Disability
In terms of ambulatory disability, the demographic groups most similar to Immigrants from Lithuania are Immigrants from Afghanistan (5.6%, a difference of 0.040%), Immigrants from Zimbabwe (5.6%, a difference of 0.080%), Immigrants from Belgium (5.6%, a difference of 0.12%), Immigrants from Spain (5.6%, a difference of 0.13%), and Immigrants from Brazil (5.6%, a difference of 0.14%).
| Demographics | Rating | Rank | Ambulatory Disability |
| Immigrants | Egypt | 99.8 /100 | #53 | Exceptional 5.6% |
| Immigrants | Eastern Africa | 99.8 /100 | #54 | Exceptional 5.6% |
| Immigrants | Bulgaria | 99.8 /100 | #55 | Exceptional 5.6% |
| Inupiat | 99.8 /100 | #56 | Exceptional 5.6% |
| Immigrants | Brazil | 99.8 /100 | #57 | Exceptional 5.6% |
| Immigrants | Zimbabwe | 99.8 /100 | #58 | Exceptional 5.6% |
| Immigrants | Afghanistan | 99.8 /100 | #59 | Exceptional 5.6% |
| Immigrants | Lithuania | 99.8 /100 | #60 | Exceptional 5.6% |
| Immigrants | Belgium | 99.7 /100 | #61 | Exceptional 5.6% |
| Immigrants | Spain | 99.7 /100 | #62 | Exceptional 5.6% |
| Immigrants | France | 99.7 /100 | #63 | Exceptional 5.6% |
| Laotians | 99.7 /100 | #64 | Exceptional 5.7% |
| Immigrants | Switzerland | 99.7 /100 | #65 | Exceptional 5.7% |
| Israelis | 99.6 /100 | #66 | Exceptional 5.7% |
| Immigrants | Uganda | 99.6 /100 | #67 | Exceptional 5.7% |