Spanish American vs Immigrants from Lithuania 10th Grade
COMPARE
Spanish American
Immigrants from Lithuania
10th Grade
10th Grade Comparison
Spanish Americans
Immigrants from Lithuania
92.9%
10TH GRADE
2.1/ 100
METRIC RATING
244th/ 347
METRIC RANK
95.0%
10TH GRADE
99.8/ 100
METRIC RATING
54th/ 347
METRIC RANK
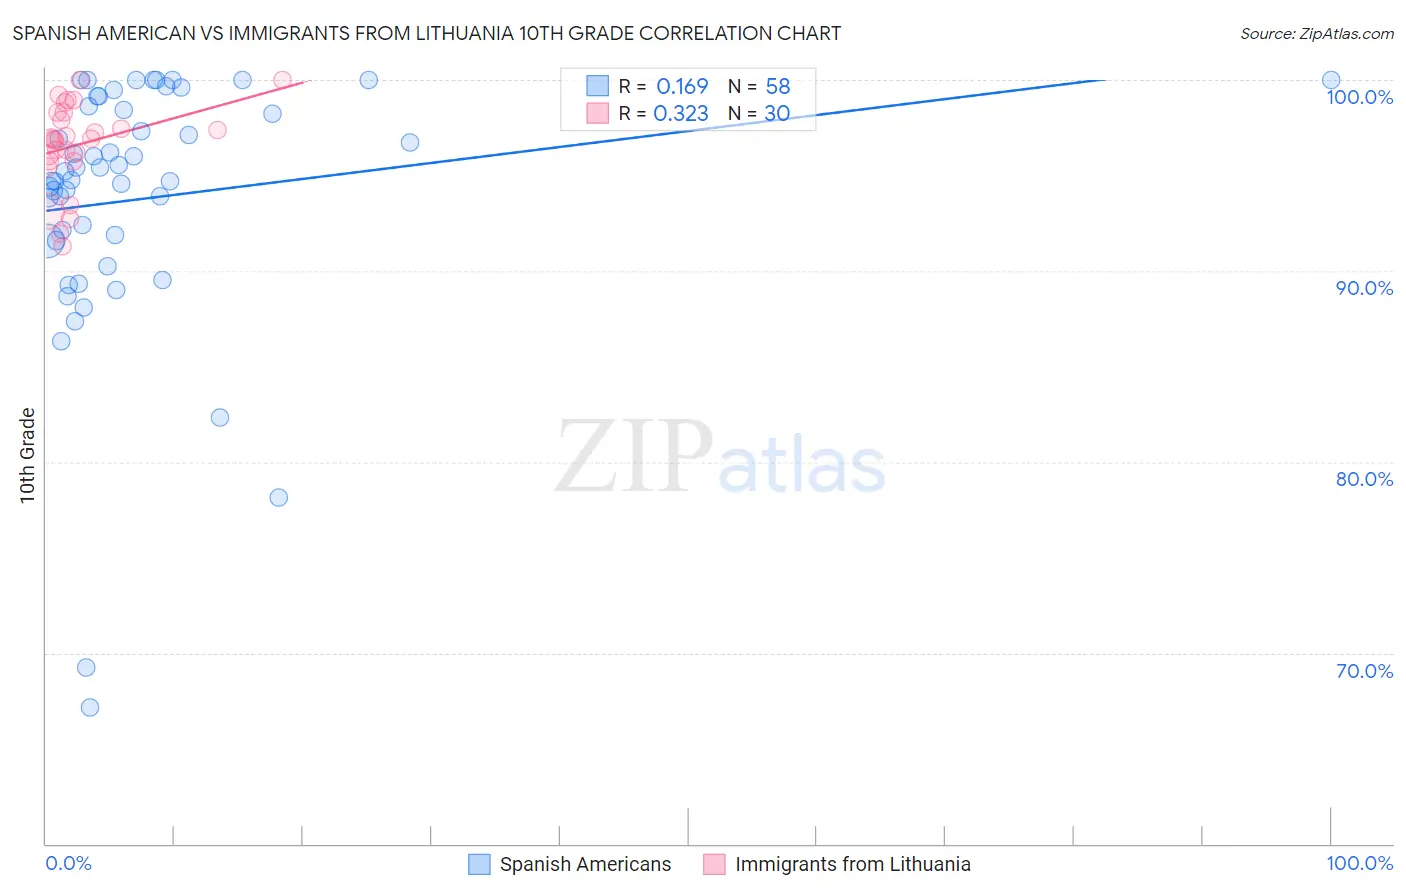
Spanish American vs Immigrants from Lithuania 10th Grade Correlation Chart
The statistical analysis conducted on geographies consisting of 103,166,592 people shows a poor positive correlation between the proportion of Spanish Americans and percentage of population with at least 10th grade education in the United States with a correlation coefficient (R) of 0.169 and weighted average of 92.9%. Similarly, the statistical analysis conducted on geographies consisting of 117,724,932 people shows a mild positive correlation between the proportion of Immigrants from Lithuania and percentage of population with at least 10th grade education in the United States with a correlation coefficient (R) of 0.323 and weighted average of 95.0%, a difference of 2.3%.
10th Grade Correlation Summary
| Measurement | Spanish American | Immigrants from Lithuania |
| Minimum | 67.1% | 91.3% |
| Maximum | 100.0% | 100.0% |
| Range | 32.9% | 8.7% |
| Mean | 93.8% | 96.6% |
| Median | 95.0% | 96.9% |
| Interquartile 25% (IQ1) | 91.6% | 95.8% |
| Interquartile 75% (IQ3) | 98.7% | 98.3% |
| Interquartile Range (IQR) | 7.1% | 2.5% |
| Standard Deviation (Sample) | 6.8% | 2.2% |
| Standard Deviation (Population) | 6.7% | 2.2% |
Similar Demographics by 10th Grade
Demographics Similar to Spanish Americans by 10th Grade
In terms of 10th grade, the demographic groups most similar to Spanish Americans are Senegalese (93.0%, a difference of 0.030%), Uruguayan (92.9%, a difference of 0.030%), Immigrants from Cameroon (93.0%, a difference of 0.050%), Immigrants from Middle Africa (92.9%, a difference of 0.050%), and Immigrants from Somalia (93.0%, a difference of 0.060%).
| Demographics | Rating | Rank | 10th Grade |
| Immigrants | Panama | 4.3 /100 | #237 | Tragic 93.1% |
| Nigerians | 4.2 /100 | #238 | Tragic 93.1% |
| Costa Ricans | 4.2 /100 | #239 | Tragic 93.1% |
| Immigrants | Hong Kong | 4.2 /100 | #240 | Tragic 93.1% |
| Immigrants | Somalia | 2.7 /100 | #241 | Tragic 93.0% |
| Immigrants | Cameroon | 2.6 /100 | #242 | Tragic 93.0% |
| Senegalese | 2.4 /100 | #243 | Tragic 93.0% |
| Spanish Americans | 2.1 /100 | #244 | Tragic 92.9% |
| Uruguayans | 1.8 /100 | #245 | Tragic 92.9% |
| Immigrants | Middle Africa | 1.7 /100 | #246 | Tragic 92.9% |
| Immigrants | Afghanistan | 1.4 /100 | #247 | Tragic 92.8% |
| Colombians | 1.4 /100 | #248 | Tragic 92.8% |
| Immigrants | Senegal | 1.4 /100 | #249 | Tragic 92.8% |
| Jamaicans | 1.2 /100 | #250 | Tragic 92.8% |
| Immigrants | Thailand | 1.0 /100 | #251 | Tragic 92.8% |
Demographics Similar to Immigrants from Lithuania by 10th Grade
In terms of 10th grade, the demographic groups most similar to Immigrants from Lithuania are Immigrants from Ireland (95.0%, a difference of 0.010%), Immigrants from North America (95.0%, a difference of 0.020%), New Zealander (95.0%, a difference of 0.020%), Ukrainian (95.0%, a difference of 0.020%), and Aleut (95.0%, a difference of 0.020%).
| Demographics | Rating | Rank | 10th Grade |
| Serbians | 99.9 /100 | #47 | Exceptional 95.1% |
| Australians | 99.9 /100 | #48 | Exceptional 95.1% |
| Immigrants | Austria | 99.9 /100 | #49 | Exceptional 95.1% |
| Immigrants | Canada | 99.8 /100 | #50 | Exceptional 95.1% |
| Austrians | 99.8 /100 | #51 | Exceptional 95.1% |
| Ottawa | 99.8 /100 | #52 | Exceptional 95.1% |
| Immigrants | North America | 99.8 /100 | #53 | Exceptional 95.0% |
| Immigrants | Lithuania | 99.8 /100 | #54 | Exceptional 95.0% |
| Immigrants | Ireland | 99.8 /100 | #55 | Exceptional 95.0% |
| New Zealanders | 99.8 /100 | #56 | Exceptional 95.0% |
| Ukrainians | 99.8 /100 | #57 | Exceptional 95.0% |
| Aleuts | 99.8 /100 | #58 | Exceptional 95.0% |
| Celtics | 99.8 /100 | #59 | Exceptional 95.0% |
| Cypriots | 99.8 /100 | #60 | Exceptional 95.0% |
| Chippewa | 99.8 /100 | #61 | Exceptional 95.0% |