British vs Immigrants from Lithuania 10th Grade
COMPARE
British
Immigrants from Lithuania
10th Grade
10th Grade Comparison
British
Immigrants from Lithuania
95.3%
10TH GRADE
99.9/ 100
METRIC RATING
34th/ 347
METRIC RANK
95.0%
10TH GRADE
99.8/ 100
METRIC RATING
54th/ 347
METRIC RANK
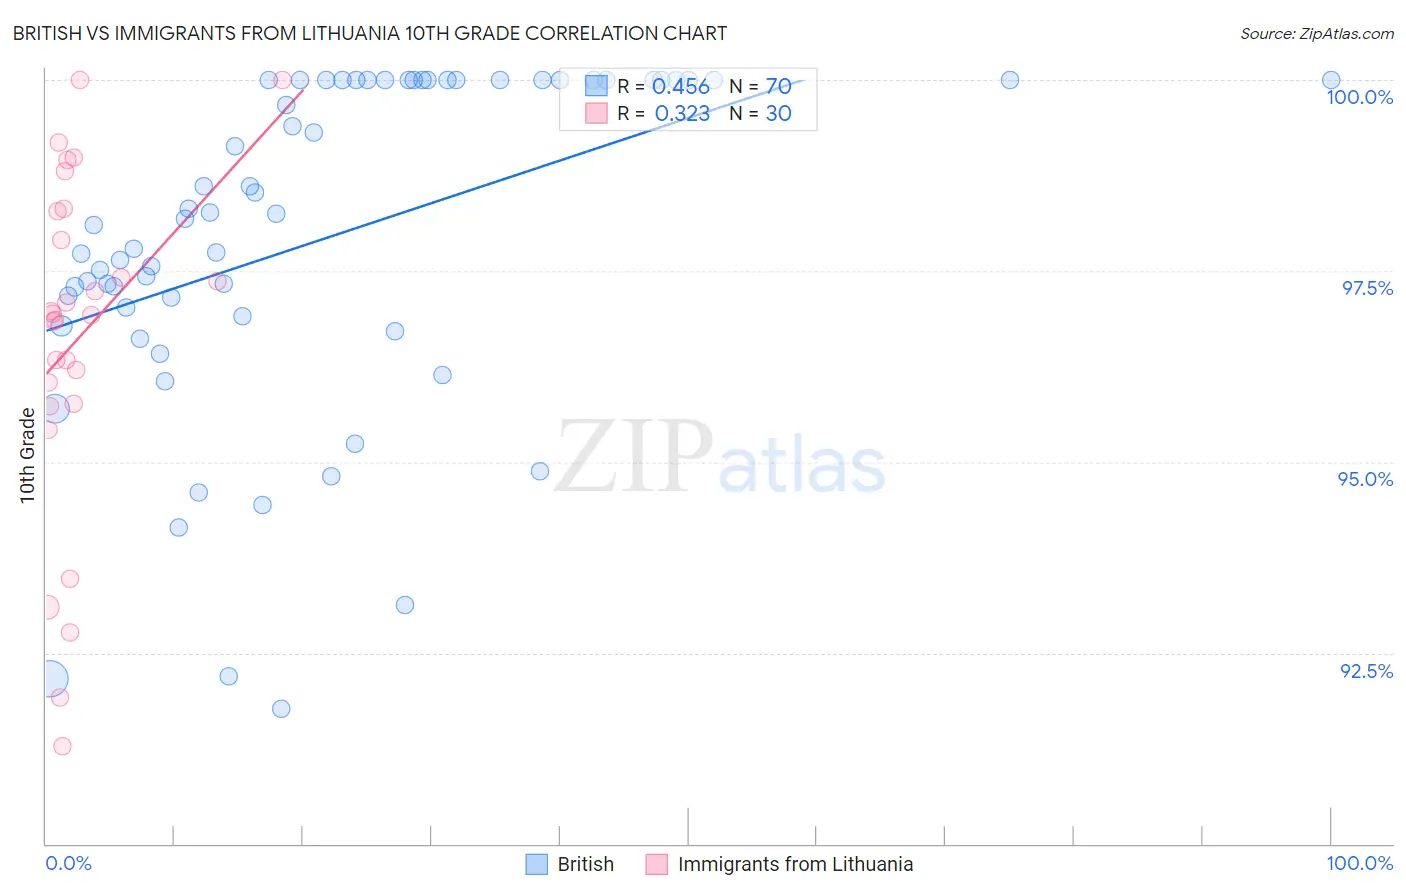
British vs Immigrants from Lithuania 10th Grade Correlation Chart
The statistical analysis conducted on geographies consisting of 531,463,601 people shows a moderate positive correlation between the proportion of British and percentage of population with at least 10th grade education in the United States with a correlation coefficient (R) of 0.456 and weighted average of 95.3%. Similarly, the statistical analysis conducted on geographies consisting of 117,724,932 people shows a mild positive correlation between the proportion of Immigrants from Lithuania and percentage of population with at least 10th grade education in the United States with a correlation coefficient (R) of 0.323 and weighted average of 95.0%, a difference of 0.30%.
10th Grade Correlation Summary
| Measurement | British | Immigrants from Lithuania |
| Minimum | 91.8% | 91.3% |
| Maximum | 100.0% | 100.0% |
| Range | 8.2% | 8.7% |
| Mean | 97.9% | 96.6% |
| Median | 98.2% | 96.9% |
| Interquartile 25% (IQ1) | 96.9% | 95.8% |
| Interquartile 75% (IQ3) | 100.0% | 98.3% |
| Interquartile Range (IQR) | 3.1% | 2.5% |
| Standard Deviation (Sample) | 2.2% | 2.2% |
| Standard Deviation (Population) | 2.2% | 2.2% |
Demographics Similar to British and Immigrants from Lithuania by 10th Grade
In terms of 10th grade, the demographic groups most similar to British are Estonian (95.3%, a difference of 0.010%), Immigrants from India (95.3%, a difference of 0.020%), French Canadian (95.3%, a difference of 0.030%), Northern European (95.3%, a difference of 0.070%), and Immigrants from Scotland (95.2%, a difference of 0.090%). Similarly, the demographic groups most similar to Immigrants from Lithuania are Immigrants from North America (95.0%, a difference of 0.020%), Austrian (95.1%, a difference of 0.030%), Ottawa (95.1%, a difference of 0.030%), Immigrants from Canada (95.1%, a difference of 0.040%), and Immigrants from Austria (95.1%, a difference of 0.070%).
| Demographics | Rating | Rank | 10th Grade |
| British | 99.9 /100 | #34 | Exceptional 95.3% |
| Estonians | 99.9 /100 | #35 | Exceptional 95.3% |
| Immigrants | India | 99.9 /100 | #36 | Exceptional 95.3% |
| French Canadians | 99.9 /100 | #37 | Exceptional 95.3% |
| Northern Europeans | 99.9 /100 | #38 | Exceptional 95.3% |
| Immigrants | Scotland | 99.9 /100 | #39 | Exceptional 95.2% |
| Scotch-Irish | 99.9 /100 | #40 | Exceptional 95.2% |
| Russians | 99.9 /100 | #41 | Exceptional 95.2% |
| Slavs | 99.9 /100 | #42 | Exceptional 95.2% |
| Macedonians | 99.9 /100 | #43 | Exceptional 95.2% |
| Immigrants | Northern Europe | 99.9 /100 | #44 | Exceptional 95.2% |
| Greeks | 99.9 /100 | #45 | Exceptional 95.2% |
| Czechoslovakians | 99.9 /100 | #46 | Exceptional 95.1% |
| Serbians | 99.9 /100 | #47 | Exceptional 95.1% |
| Australians | 99.9 /100 | #48 | Exceptional 95.1% |
| Immigrants | Austria | 99.9 /100 | #49 | Exceptional 95.1% |
| Immigrants | Canada | 99.8 /100 | #50 | Exceptional 95.1% |
| Austrians | 99.8 /100 | #51 | Exceptional 95.1% |
| Ottawa | 99.8 /100 | #52 | Exceptional 95.1% |
| Immigrants | North America | 99.8 /100 | #53 | Exceptional 95.0% |
| Immigrants | Lithuania | 99.8 /100 | #54 | Exceptional 95.0% |