Barbadian vs Immigrants from Lithuania Doctorate Degree
COMPARE
Barbadian
Immigrants from Lithuania
Doctorate Degree
Doctorate Degree Comparison
Barbadians
Immigrants from Lithuania
1.6%
DOCTORATE DEGREE
3.3/ 100
METRIC RATING
233rd/ 347
METRIC RANK
2.2%
DOCTORATE DEGREE
99.6/ 100
METRIC RATING
83rd/ 347
METRIC RANK
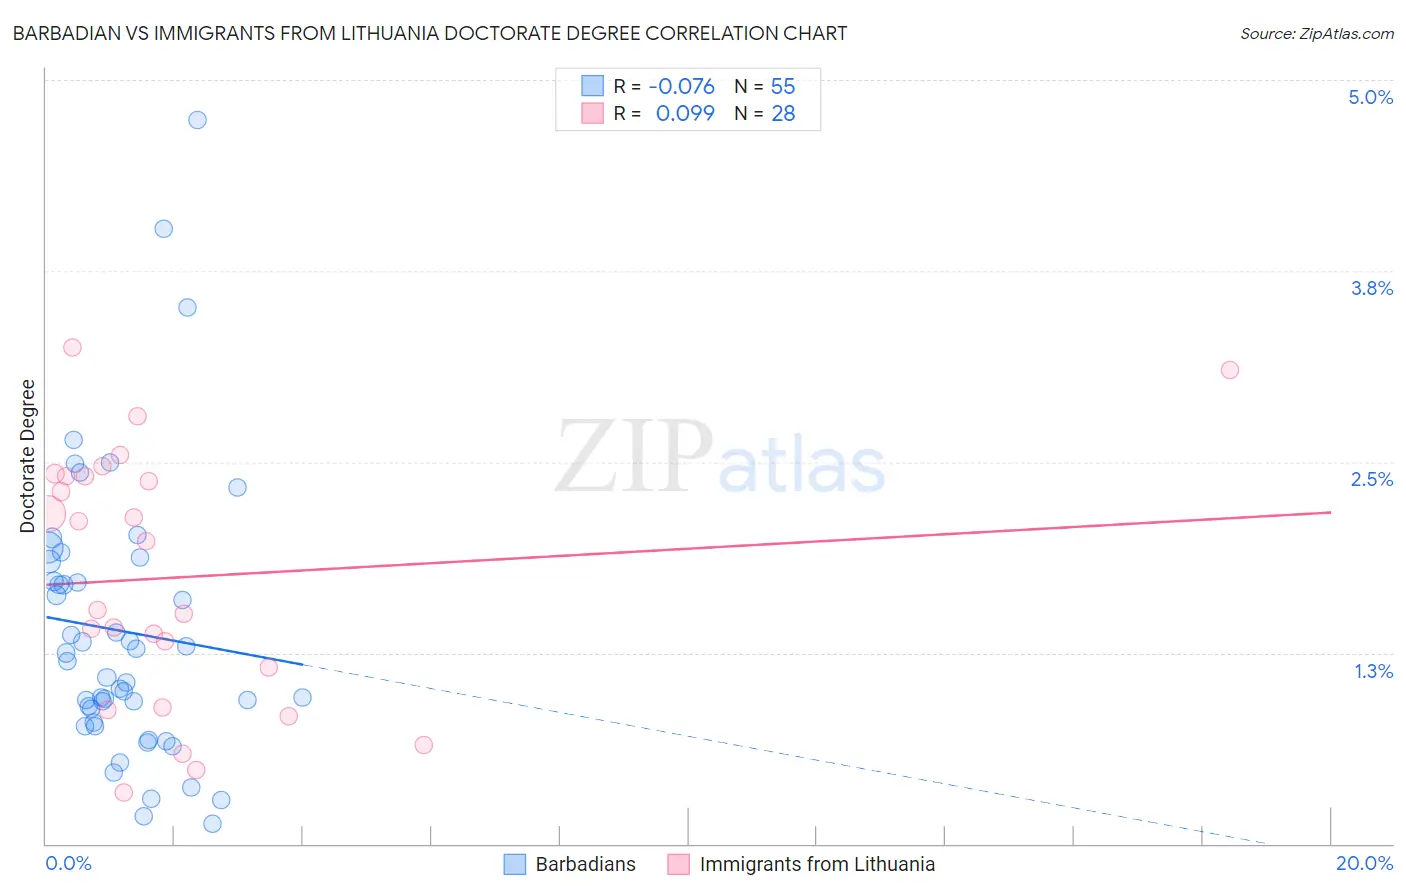
Barbadian vs Immigrants from Lithuania Doctorate Degree Correlation Chart
The statistical analysis conducted on geographies consisting of 140,930,059 people shows a slight negative correlation between the proportion of Barbadians and percentage of population with at least doctorate degree education in the United States with a correlation coefficient (R) of -0.076 and weighted average of 1.6%. Similarly, the statistical analysis conducted on geographies consisting of 117,578,099 people shows a slight positive correlation between the proportion of Immigrants from Lithuania and percentage of population with at least doctorate degree education in the United States with a correlation coefficient (R) of 0.099 and weighted average of 2.2%, a difference of 37.2%.
Doctorate Degree Correlation Summary
| Measurement | Barbadian | Immigrants from Lithuania |
| Minimum | 0.13% | 0.34% |
| Maximum | 4.7% | 3.2% |
| Range | 4.6% | 2.9% |
| Mean | 1.4% | 1.7% |
| Median | 1.2% | 1.8% |
| Interquartile 25% (IQ1) | 0.80% | 1.0% |
| Interquartile 75% (IQ3) | 1.8% | 2.4% |
| Interquartile Range (IQR) | 1.1% | 1.4% |
| Standard Deviation (Sample) | 0.91% | 0.82% |
| Standard Deviation (Population) | 0.90% | 0.81% |
Similar Demographics by Doctorate Degree
Demographics Similar to Barbadians by Doctorate Degree
In terms of doctorate degree, the demographic groups most similar to Barbadians are Guamanian/Chamorro (1.6%, a difference of 0.070%), Hopi (1.6%, a difference of 0.15%), Cree (1.6%, a difference of 0.36%), Indonesian (1.6%, a difference of 0.64%), and Immigrants from North Macedonia (1.6%, a difference of 0.76%).
| Demographics | Rating | Rank | Doctorate Degree |
| Osage | 6.5 /100 | #226 | Tragic 1.7% |
| Panamanians | 6.3 /100 | #227 | Tragic 1.7% |
| Assyrians/Chaldeans/Syriacs | 5.9 /100 | #228 | Tragic 1.7% |
| Colville | 4.7 /100 | #229 | Tragic 1.6% |
| Immigrants | Philippines | 4.3 /100 | #230 | Tragic 1.6% |
| Immigrants | North Macedonia | 3.9 /100 | #231 | Tragic 1.6% |
| Guamanians/Chamorros | 3.3 /100 | #232 | Tragic 1.6% |
| Barbadians | 3.3 /100 | #233 | Tragic 1.6% |
| Hopi | 3.2 /100 | #234 | Tragic 1.6% |
| Cree | 3.0 /100 | #235 | Tragic 1.6% |
| Indonesians | 2.8 /100 | #236 | Tragic 1.6% |
| Iroquois | 2.7 /100 | #237 | Tragic 1.6% |
| Immigrants | Congo | 2.6 /100 | #238 | Tragic 1.6% |
| West Indians | 2.5 /100 | #239 | Tragic 1.6% |
| Immigrants | Panama | 2.4 /100 | #240 | Tragic 1.6% |
Demographics Similar to Immigrants from Lithuania by Doctorate Degree
In terms of doctorate degree, the demographic groups most similar to Immigrants from Lithuania are Immigrants from England (2.2%, a difference of 0.14%), Immigrants from Uganda (2.2%, a difference of 0.17%), Immigrants from Brazil (2.2%, a difference of 0.27%), Immigrants from Argentina (2.2%, a difference of 0.71%), and Ugandan (2.2%, a difference of 0.77%).
| Demographics | Rating | Rank | Doctorate Degree |
| Immigrants | Hungary | 99.8 /100 | #76 | Exceptional 2.2% |
| Immigrants | Lebanon | 99.8 /100 | #77 | Exceptional 2.2% |
| Immigrants | Belarus | 99.7 /100 | #78 | Exceptional 2.2% |
| Northern Europeans | 99.7 /100 | #79 | Exceptional 2.2% |
| Ugandans | 99.7 /100 | #80 | Exceptional 2.2% |
| Immigrants | Argentina | 99.7 /100 | #81 | Exceptional 2.2% |
| Immigrants | Uganda | 99.6 /100 | #82 | Exceptional 2.2% |
| Immigrants | Lithuania | 99.6 /100 | #83 | Exceptional 2.2% |
| Immigrants | England | 99.6 /100 | #84 | Exceptional 2.2% |
| Immigrants | Brazil | 99.6 /100 | #85 | Exceptional 2.2% |
| Egyptians | 99.4 /100 | #86 | Exceptional 2.2% |
| Immigrants | Zimbabwe | 99.4 /100 | #87 | Exceptional 2.2% |
| Immigrants | Nepal | 99.3 /100 | #88 | Exceptional 2.2% |
| British | 99.3 /100 | #89 | Exceptional 2.2% |
| Immigrants | Scotland | 99.2 /100 | #90 | Exceptional 2.2% |