Pueblo vs Immigrants from Lithuania 10th Grade
COMPARE
Pueblo
Immigrants from Lithuania
10th Grade
10th Grade Comparison
Pueblo
Immigrants from Lithuania
93.5%
10TH GRADE
23.9/ 100
METRIC RATING
197th/ 347
METRIC RANK
95.0%
10TH GRADE
99.8/ 100
METRIC RATING
54th/ 347
METRIC RANK
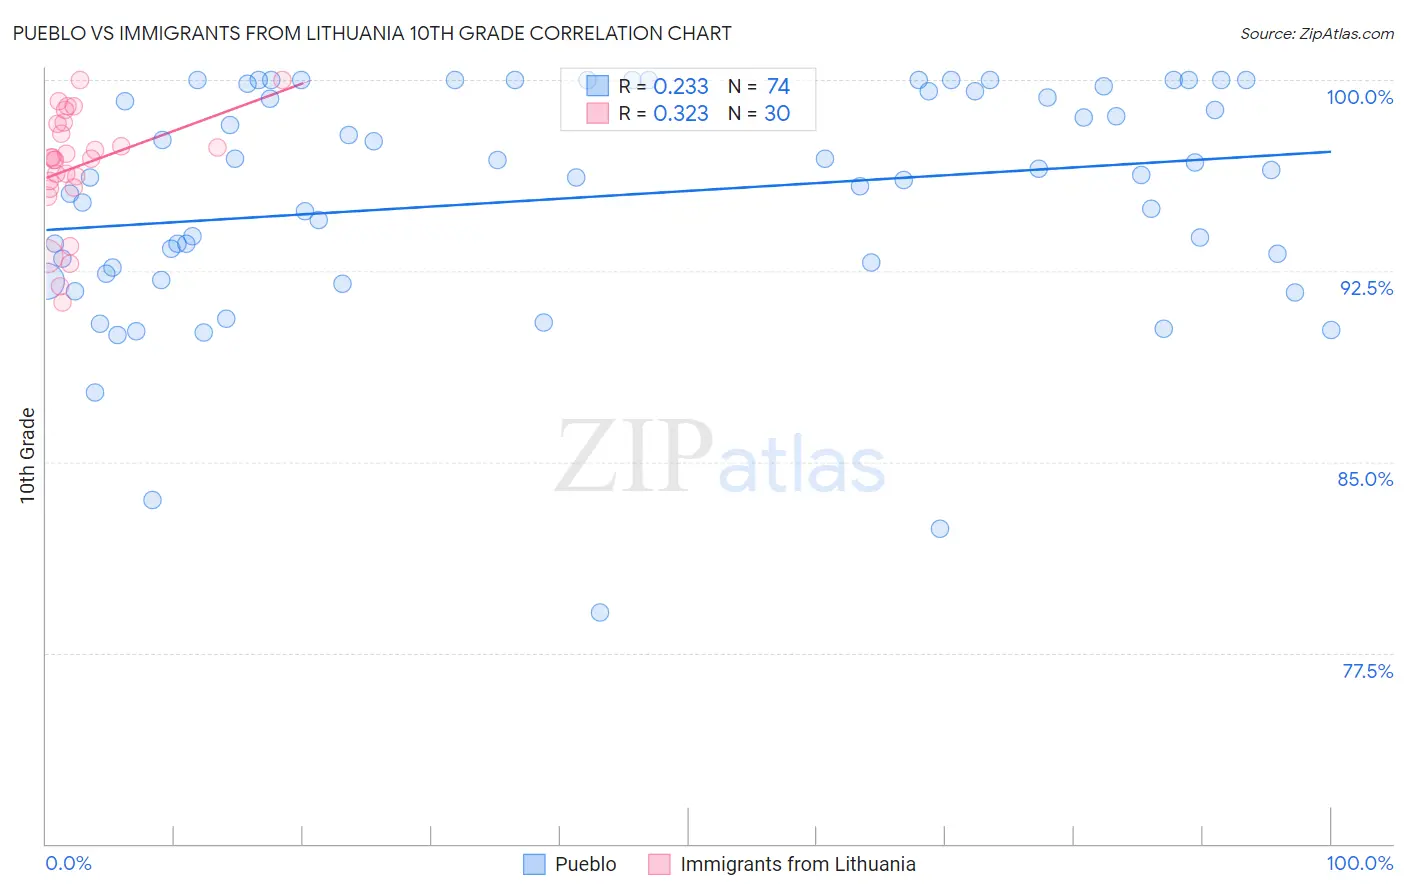
Pueblo vs Immigrants from Lithuania 10th Grade Correlation Chart
The statistical analysis conducted on geographies consisting of 120,087,458 people shows a weak positive correlation between the proportion of Pueblo and percentage of population with at least 10th grade education in the United States with a correlation coefficient (R) of 0.233 and weighted average of 93.5%. Similarly, the statistical analysis conducted on geographies consisting of 117,724,932 people shows a mild positive correlation between the proportion of Immigrants from Lithuania and percentage of population with at least 10th grade education in the United States with a correlation coefficient (R) of 0.323 and weighted average of 95.0%, a difference of 1.7%.
10th Grade Correlation Summary
| Measurement | Pueblo | Immigrants from Lithuania |
| Minimum | 79.1% | 91.3% |
| Maximum | 100.0% | 100.0% |
| Range | 20.9% | 8.7% |
| Mean | 95.4% | 96.6% |
| Median | 96.2% | 96.9% |
| Interquartile 25% (IQ1) | 92.6% | 95.8% |
| Interquartile 75% (IQ3) | 99.6% | 98.3% |
| Interquartile Range (IQR) | 7.0% | 2.5% |
| Standard Deviation (Sample) | 4.5% | 2.2% |
| Standard Deviation (Population) | 4.5% | 2.2% |
Similar Demographics by 10th Grade
Demographics Similar to Pueblo by 10th Grade
In terms of 10th grade, the demographic groups most similar to Pueblo are Immigrants from Micronesia (93.5%, a difference of 0.010%), Asian (93.5%, a difference of 0.010%), Moroccan (93.5%, a difference of 0.020%), Hopi (93.5%, a difference of 0.020%), and Cheyenne (93.5%, a difference of 0.030%).
| Demographics | Rating | Rank | 10th Grade |
| Laotians | 32.1 /100 | #190 | Fair 93.6% |
| Yup'ik | 31.1 /100 | #191 | Fair 93.6% |
| Immigrants | Malaysia | 28.0 /100 | #192 | Fair 93.5% |
| Panamanians | 28.0 /100 | #193 | Fair 93.5% |
| Immigrants | Morocco | 26.9 /100 | #194 | Fair 93.5% |
| Cheyenne | 26.8 /100 | #195 | Fair 93.5% |
| Moroccans | 25.3 /100 | #196 | Fair 93.5% |
| Pueblo | 23.9 /100 | #197 | Fair 93.5% |
| Immigrants | Micronesia | 23.2 /100 | #198 | Fair 93.5% |
| Asians | 23.0 /100 | #199 | Fair 93.5% |
| Hopi | 22.2 /100 | #200 | Fair 93.5% |
| Hawaiians | 21.8 /100 | #201 | Fair 93.5% |
| Immigrants | Uganda | 20.9 /100 | #202 | Fair 93.5% |
| Immigrants | Western Asia | 20.6 /100 | #203 | Fair 93.4% |
| Ute | 20.3 /100 | #204 | Fair 93.4% |
Demographics Similar to Immigrants from Lithuania by 10th Grade
In terms of 10th grade, the demographic groups most similar to Immigrants from Lithuania are Immigrants from Ireland (95.0%, a difference of 0.010%), Immigrants from North America (95.0%, a difference of 0.020%), New Zealander (95.0%, a difference of 0.020%), Ukrainian (95.0%, a difference of 0.020%), and Aleut (95.0%, a difference of 0.020%).
| Demographics | Rating | Rank | 10th Grade |
| Serbians | 99.9 /100 | #47 | Exceptional 95.1% |
| Australians | 99.9 /100 | #48 | Exceptional 95.1% |
| Immigrants | Austria | 99.9 /100 | #49 | Exceptional 95.1% |
| Immigrants | Canada | 99.8 /100 | #50 | Exceptional 95.1% |
| Austrians | 99.8 /100 | #51 | Exceptional 95.1% |
| Ottawa | 99.8 /100 | #52 | Exceptional 95.1% |
| Immigrants | North America | 99.8 /100 | #53 | Exceptional 95.0% |
| Immigrants | Lithuania | 99.8 /100 | #54 | Exceptional 95.0% |
| Immigrants | Ireland | 99.8 /100 | #55 | Exceptional 95.0% |
| New Zealanders | 99.8 /100 | #56 | Exceptional 95.0% |
| Ukrainians | 99.8 /100 | #57 | Exceptional 95.0% |
| Aleuts | 99.8 /100 | #58 | Exceptional 95.0% |
| Celtics | 99.8 /100 | #59 | Exceptional 95.0% |
| Cypriots | 99.8 /100 | #60 | Exceptional 95.0% |
| Chippewa | 99.8 /100 | #61 | Exceptional 95.0% |