Spaniard vs Immigrants from Lithuania 10th Grade

COMPARE

Spaniard
Race
Ancestry
AfghanAfricanAlaska NativeAlaskan AthabascanAlbanianAleutAlsatianAmericanApacheArabArapahoArgentineanArmenianAssyrian/Chaldean/SyriacAustralianAustrianBahamianBangladeshiBarbadianBasqueBelgianBelizeanBermudanBhutaneseBlackfeetBolivianBrazilianBritishBritish West IndianBulgarianBurmeseCajunCambodianCanadianCape VerdeanCarpatho RusynCelticCentral AmericanCentral American IndianCherokeeCheyenneChickasawChileanChineseChippewaChoctawColombianColvilleComancheCosta RicanCreeCreekCroatianCrowCubanCypriotCzechCzechoslovakianDanishDelawareDominicanDutchDutch West IndianEastern EuropeanEcuadorianEgyptianEnglishEstonianEthiopianEuropeanFijianFilipinoFinnishFrenchFrench American IndianFrench CanadianGermanGerman RussianGhanaianGreekGuamanian/ChamorroGuatemalanGuyaneseHaitianHmongHonduranHopiHoumaHungarianIcelanderIndian (Asian)IndonesianInupiatIranianIraqiIrishIroquoisIsraeliItalianJamaicanJapaneseJordanianKenyanKiowaKoreanLaotianLatvianLebaneseLiberianLithuanianLumbeeLuxembourgerMacedonianMalaysianMalteseMarshalleseMenomineeMexicanMexican American IndianMongolianMoroccanNative HawaiianNavajoNepaleseNew ZealanderNicaraguanNigerianNorthern EuropeanNorwegianOkinawanOsageOttawaPaiutePakistaniPalestinianPanamanianParaguayanPennsylvania GermanPeruvianPimaPolishPortuguesePotawatomiPuebloPuerto RicanPuget Sound SalishRomanianRussianSalvadoranSamoanScandinavianScotch-IrishScottishSeminoleSenegaleseSerbianShoshoneSierra LeoneanSiouxSlavicSlovakSloveneSomaliSouth AfricanSouth AmericanSouth American IndianSoviet UnionSpaniardSpanishSpanish AmericanSpanish American IndianSri LankanSubsaharan AfricanSudaneseSwedishSwissSyrianTaiwaneseThaiTlingit-HaidaTohono O'OdhamTonganTrinidadian and TobagonianTsimshianTurkishU.S. Virgin IslanderUgandanUkrainianUruguayanUteVenezuelanVietnameseWelshWest IndianYakamaYaquiYugoslavianYumanYup'ikZimbabwean
Immigration
NonimmigrantsImmigrantsAfghanistanAfricaAlbaniaArgentinaArmeniaAsiaAustraliaAustriaBahamasBangladeshBarbadosBelarusBelgiumBelizeBoliviaBosnia and HerzegovinaBrazilBulgariaBurma/MyanmarCabo VerdeCambodiaCameroonCanadaCaribbeanCentral AmericaChileChinaColombiaCongoCosta RicaCroatiaCubaCzechoslovakiaDenmarkDominicaDominican RepublicEastern AfricaEastern AsiaEastern EuropeEcuadorEgyptEl SalvadorEnglandEritreaEthiopiaEuropeFijiFranceGermanyGhanaGreeceGrenadaGuatemalaGuyanaHaitiHondurasHong KongHungaryIndiaIndonesiaIranIraqIrelandIsraelItalyJamaicaJapanJordanKazakhstanKenyaKoreaKuwaitLaosLatin AmericaLatviaLebanonLiberiaMalaysiaMexicoMicronesiaMiddle AfricaMoldovaMoroccoNepalNetherlandsNicaraguaNigeriaNorth AmericaNorth MacedoniaNorthern AfricaNorthern EuropeNorwayOceaniaPakistanPanamaPeruPhilippinesPolandPortugalRomaniaRussiaSaudi ArabiaScotlandSenegalSerbiaSierra LeoneSingaporeSomaliaSouth AfricaSouth AmericaSouth Central AsiaSouth Eastern AsiaSouthern EuropeSpainSri LankaSt. Vincent and the GrenadinesSudanSwedenSwitzerlandSyriaTaiwanThailandTrinidad and TobagoTurkeyUgandaUkraineUruguayUzbekistanVenezuelaVietnamWest IndiesWestern AfricaWestern AsiaWestern EuropeYemenZaireZimbabweAzores
Immigrants from Lithuania
Race
Ancestry
AfghanAfricanAlaska NativeAlaskan AthabascanAlbanianAleutAlsatianAmericanApacheArabArapahoArgentineanArmenianAssyrian/Chaldean/SyriacAustralianAustrianBahamianBangladeshiBarbadianBasqueBelgianBelizeanBermudanBhutaneseBlackfeetBolivianBrazilianBritishBritish West IndianBulgarianBurmeseCajunCambodianCanadianCape VerdeanCarpatho RusynCelticCentral AmericanCentral American IndianCherokeeCheyenneChickasawChileanChineseChippewaChoctawColombianColvilleComancheCosta RicanCreeCreekCroatianCrowCubanCypriotCzechCzechoslovakianDanishDelawareDominicanDutchDutch West IndianEastern EuropeanEcuadorianEgyptianEnglishEstonianEthiopianEuropeanFijianFilipinoFinnishFrenchFrench American IndianFrench CanadianGermanGerman RussianGhanaianGreekGuamanian/ChamorroGuatemalanGuyaneseHaitianHmongHonduranHopiHoumaHungarianIcelanderIndian (Asian)IndonesianInupiatIranianIraqiIrishIroquoisIsraeliItalianJamaicanJapaneseJordanianKenyanKiowaKoreanLaotianLatvianLebaneseLiberianLithuanianLumbeeLuxembourgerMacedonianMalaysianMalteseMarshalleseMenomineeMexicanMexican American IndianMongolianMoroccanNative HawaiianNavajoNepaleseNew ZealanderNicaraguanNigerianNorthern EuropeanNorwegianOkinawanOsageOttawaPaiutePakistaniPalestinianPanamanianParaguayanPennsylvania GermanPeruvianPimaPolishPortuguesePotawatomiPuebloPuerto RicanPuget Sound SalishRomanianRussianSalvadoranSamoanScandinavianScotch-IrishScottishSeminoleSenegaleseSerbianShoshoneSierra LeoneanSiouxSlavicSlovakSloveneSomaliSouth AfricanSouth AmericanSouth American IndianSoviet UnionSpanishSpanish AmericanSpanish American IndianSri LankanSubsaharan AfricanSudaneseSwedishSwissSyrianTaiwaneseThaiTlingit-HaidaTohono O'OdhamTonganTrinidadian and TobagonianTsimshianTurkishU.S. Virgin IslanderUgandanUkrainianUruguayanUteVenezuelanVietnameseWelshWest IndianYakamaYaquiYugoslavianYumanYup'ikZimbabwean
Immigration
NonimmigrantsImmigrantsAfghanistanAfricaAlbaniaArgentinaArmeniaAsiaAustraliaAustriaBahamasBangladeshBarbadosBelarusBelgiumBelizeBoliviaBosnia and HerzegovinaBrazilBulgariaBurma/MyanmarCabo VerdeCambodiaCameroonCanadaCaribbeanCentral AmericaChileChinaColombiaCongoCosta RicaCroatiaCubaCzechoslovakiaDenmarkDominicaDominican RepublicEastern AfricaEastern AsiaEastern EuropeEcuadorEgyptEl SalvadorEnglandEritreaEthiopiaEuropeFijiFranceGermanyGhanaGreeceGrenadaGuatemalaGuyanaHaitiHondurasHong KongHungaryIndiaIndonesiaIranIraqIrelandIsraelItalyJamaicaJapanJordanKazakhstanKenyaKoreaKuwaitLaosLatin AmericaLatviaLebanonLiberiaLithuaniaMalaysiaMexicoMicronesiaMiddle AfricaMoldovaMoroccoNepalNetherlandsNicaraguaNigeriaNorth AmericaNorth MacedoniaNorthern AfricaNorthern EuropeNorwayOceaniaPakistanPanamaPeruPhilippinesPolandPortugalRomaniaRussiaSaudi ArabiaScotlandSenegalSerbiaSierra LeoneSingaporeSomaliaSouth AfricaSouth AmericaSouth Central AsiaSouth Eastern AsiaSouthern EuropeSpainSri LankaSt. Vincent and the GrenadinesSudanSwedenSwitzerlandSyriaTaiwanThailandTrinidad and TobagoTurkeyUgandaUkraineUruguayUzbekistanVenezuelaVietnamWest IndiesWestern AfricaWestern AsiaWestern EuropeYemenZaireZimbabweAzores
10th Grade
Income
Poverty
Unemployment
Labor Participation
Family Structure
Vehicle Availability
Education Level
Disability

10th Grade Comparison

Spaniards

Immigrants from Lithuania

Average
Exceptional
93.7%
10TH GRADE
50.3/ 100
METRIC RATING
173rd/ 347
METRIC RANK
95.0%
10TH GRADE
99.8/ 100
METRIC RATING
54th/ 347
METRIC RANK

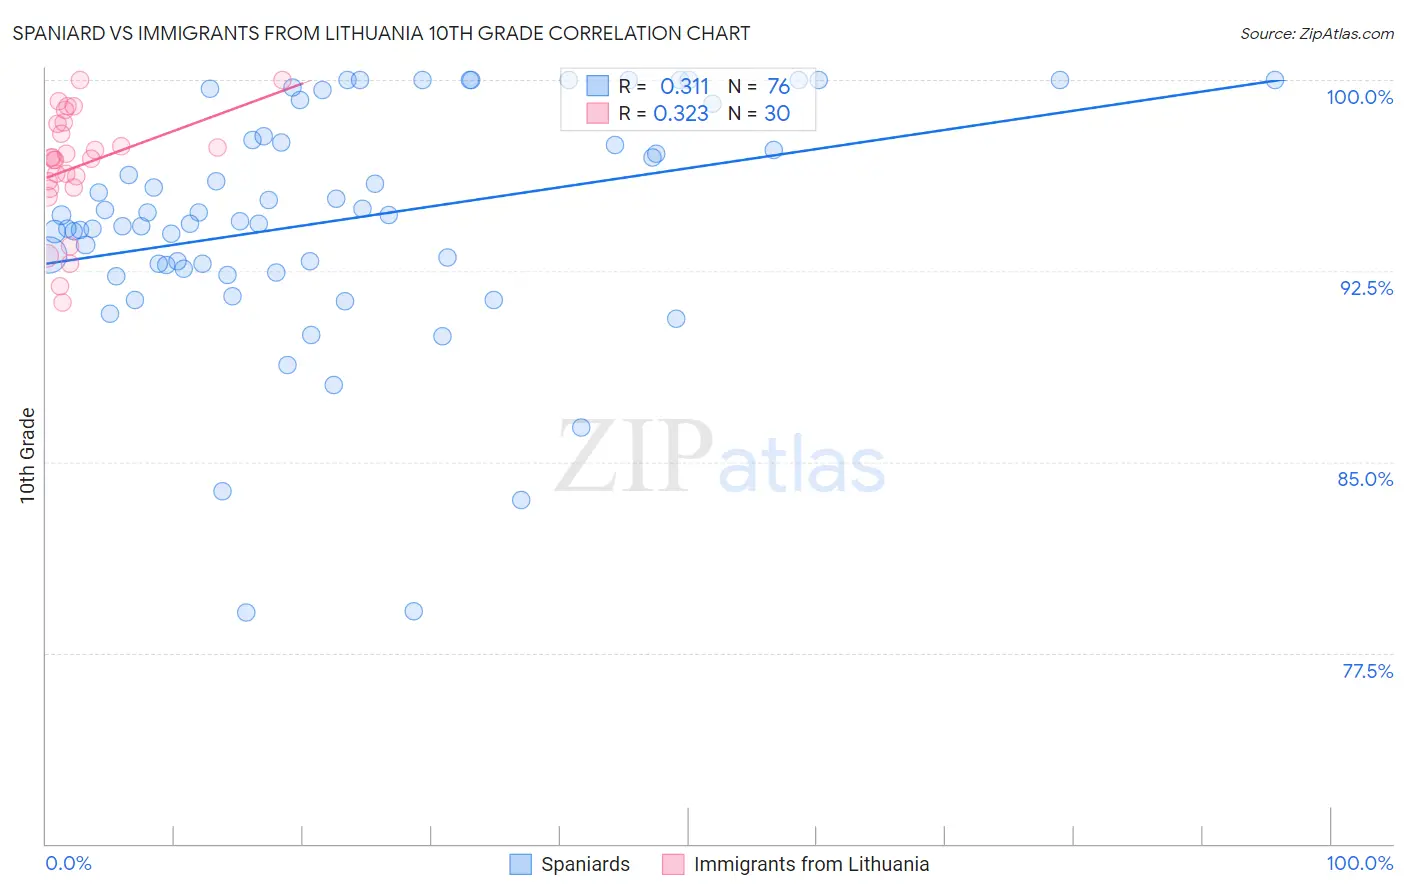
Spaniard vs Immigrants from Lithuania 10th Grade Correlation Chart

The statistical analysis conducted on geographies consisting of 443,545,794 people shows a mild positive correlation between the proportion of Spaniards and percentage of population with at least 10th grade education in the United States with a correlation coefficient (R) of 0.311 and weighted average of 93.7%. Similarly, the statistical analysis conducted on geographies consisting of 117,724,932 people shows a mild positive correlation between the proportion of Immigrants from Lithuania and percentage of population with at least 10th grade education in the United States with a correlation coefficient (R) of 0.323 and weighted average of 95.0%, a difference of 1.4%.
Spaniard vs Immigrants from Lithuania 10th Grade

10th Grade Correlation Summary

MeasurementSpaniardImmigrants from Lithuania
Minimum79.1%91.3%
Maximum100.0%100.0%
Range20.9%8.7%
Mean94.5%96.6%
Median94.6%96.9%
Interquartile 25% (IQ1)92.6%95.8%
Interquartile 75% (IQ3)97.7%98.3%
Interquartile Range (IQR)5.1%2.5%
Standard Deviation (Sample)4.6%2.2%
Standard Deviation (Population)4.6%2.2%

Similar Demographics by 10th Grade

Demographics Similar to Spaniards by 10th Grade

In terms of 10th grade, the demographic groups most similar to Spaniards are Argentinean (93.7%, a difference of 0.0%), French American Indian (93.7%, a difference of 0.010%), Immigrants from Nepal (93.7%, a difference of 0.010%), Immigrants from Albania (93.8%, a difference of 0.020%), and Immigrants from Venezuela (93.8%, a difference of 0.030%).
DemographicsRating | Rank10th Grade
Immigrants | Iraq
63.0
/100
|
#166
Good
93.8%
Immigrants | Egypt
62.3
/100
|
#167
Good
93.8%
Alsatians
59.4
/100
|
#168
Average
93.8%
Immigrants | Spain
55.9
/100
|
#169
Average
93.8%
Immigrants | Venezuela
53.9
/100
|
#170
Average
93.8%
Immigrants | Albania
52.4
/100
|
#171
Average
93.8%
French American Indians
50.9
/100
|
#172
Average
93.7%
Spaniards
50.3
/100
|
#173
Average
93.7%
Argentineans
50.0
/100
|
#174
Average
93.7%
Immigrants | Nepal
49.6
/100
|
#175
Average
93.7%
Immigrants | Argentina
47.1
/100
|
#176
Average
93.7%
Immigrants | Lebanon
47.1
/100
|
#177
Average
93.7%
Sierra Leoneans
46.1
/100
|
#178
Average
93.7%
Paraguayans
45.3
/100
|
#179
Average
93.7%
Blackfeet
42.8
/100
|
#180
Average
93.7%

Demographics Similar to Immigrants from Lithuania by 10th Grade

In terms of 10th grade, the demographic groups most similar to Immigrants from Lithuania are Immigrants from Ireland (95.0%, a difference of 0.010%), Immigrants from North America (95.0%, a difference of 0.020%), New Zealander (95.0%, a difference of 0.020%), Ukrainian (95.0%, a difference of 0.020%), and Aleut (95.0%, a difference of 0.020%).
DemographicsRating | Rank10th Grade
Serbians
99.9
/100
|
#47
Exceptional
95.1%
Australians
99.9
/100
|
#48
Exceptional
95.1%
Immigrants | Austria
99.9
/100
|
#49
Exceptional
95.1%
Immigrants | Canada
99.8
/100
|
#50
Exceptional
95.1%
Austrians
99.8
/100
|
#51
Exceptional
95.1%
Ottawa
99.8
/100
|
#52
Exceptional
95.1%
Immigrants | North America
99.8
/100
|
#53
Exceptional
95.0%
Immigrants | Lithuania
99.8
/100
|
#54
Exceptional
95.0%
Immigrants | Ireland
99.8
/100
|
#55
Exceptional
95.0%
New Zealanders
99.8
/100
|
#56
Exceptional
95.0%
Ukrainians
99.8
/100
|
#57
Exceptional
95.0%
Aleuts
99.8
/100
|
#58
Exceptional
95.0%
Celtics
99.8
/100
|
#59
Exceptional
95.0%
Cypriots
99.8
/100
|
#60
Exceptional
95.0%
Chippewa
99.8
/100
|
#61
Exceptional
95.0%