Bahamian vs Chippewa High School Diploma
COMPARE
Bahamian
Chippewa
High School Diploma
High School Diploma Comparison
Bahamians
Chippewa
87.5%
HIGH SCHOOL DIPLOMA
0.7/ 100
METRIC RATING
257th/ 347
METRIC RANK
89.7%
HIGH SCHOOL DIPLOMA
85.6/ 100
METRIC RATING
135th/ 347
METRIC RANK
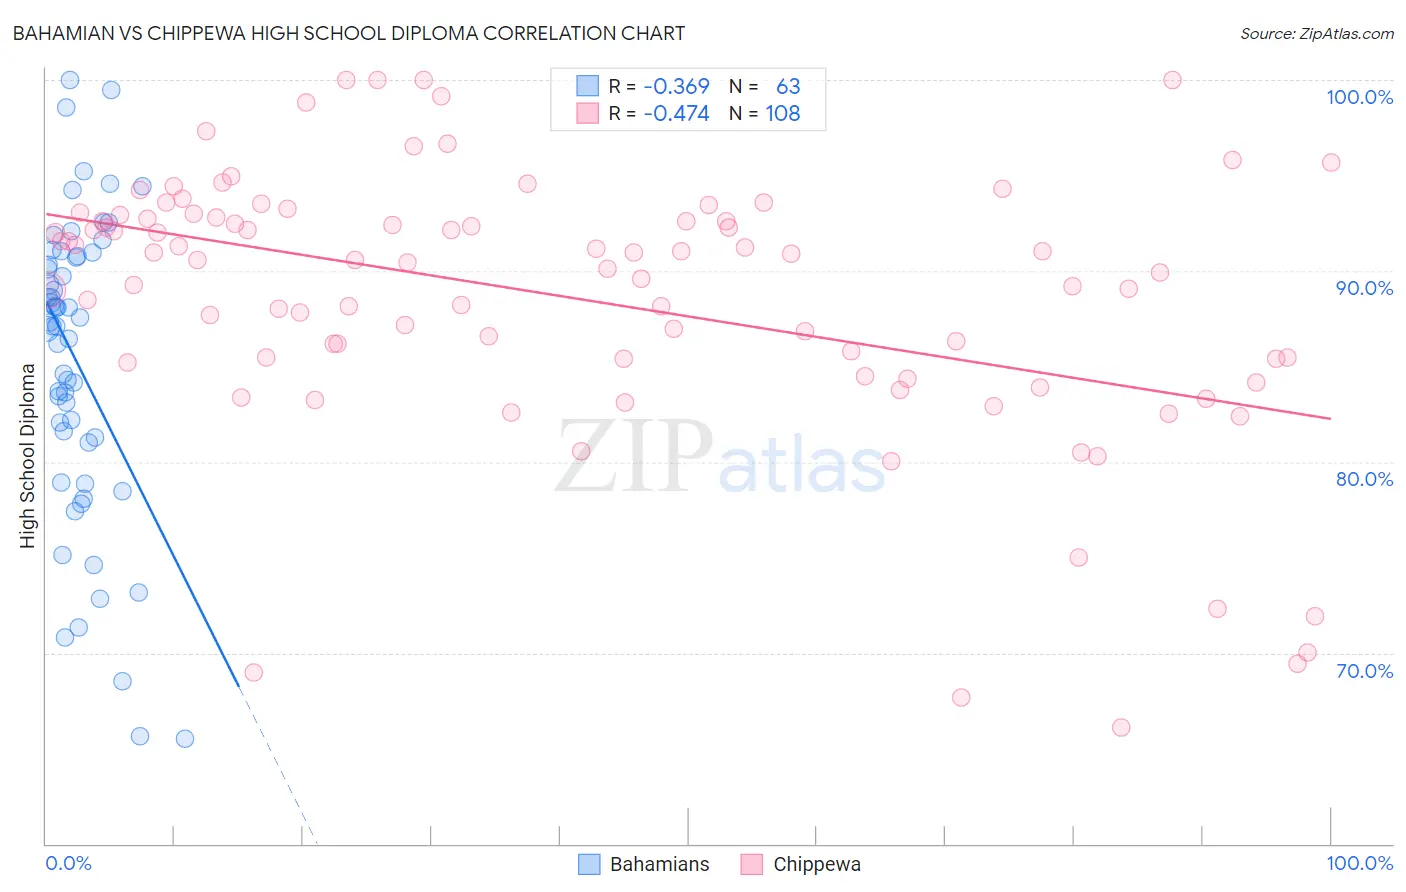
Bahamian vs Chippewa High School Diploma Correlation Chart
The statistical analysis conducted on geographies consisting of 112,698,819 people shows a mild negative correlation between the proportion of Bahamians and percentage of population with at least high school diploma education in the United States with a correlation coefficient (R) of -0.369 and weighted average of 87.5%. Similarly, the statistical analysis conducted on geographies consisting of 215,068,347 people shows a moderate negative correlation between the proportion of Chippewa and percentage of population with at least high school diploma education in the United States with a correlation coefficient (R) of -0.474 and weighted average of 89.7%, a difference of 2.6%.
High School Diploma Correlation Summary
| Measurement | Bahamian | Chippewa |
| Minimum | 65.5% | 66.1% |
| Maximum | 100.0% | 100.0% |
| Range | 34.5% | 33.9% |
| Mean | 85.2% | 88.6% |
| Median | 87.1% | 90.6% |
| Interquartile 25% (IQ1) | 81.0% | 85.4% |
| Interquartile 75% (IQ3) | 90.8% | 92.8% |
| Interquartile Range (IQR) | 9.8% | 7.4% |
| Standard Deviation (Sample) | 7.9% | 7.0% |
| Standard Deviation (Population) | 7.9% | 7.0% |
Similar Demographics by High School Diploma
Demographics Similar to Bahamians by High School Diploma
In terms of high school diploma, the demographic groups most similar to Bahamians are African (87.5%, a difference of 0.0%), Immigrants from Senegal (87.6%, a difference of 0.10%), Immigrants from Ghana (87.4%, a difference of 0.10%), Immigrants from Western Africa (87.4%, a difference of 0.11%), and Immigrants from Colombia (87.6%, a difference of 0.16%).
| Demographics | Rating | Rank | High School Diploma |
| Immigrants | Nigeria | 1.5 /100 | #250 | Tragic 87.7% |
| Ghanaians | 1.4 /100 | #251 | Tragic 87.7% |
| Immigrants | South America | 1.2 /100 | #252 | Tragic 87.6% |
| Immigrants | Uruguay | 1.0 /100 | #253 | Tragic 87.6% |
| Immigrants | Colombia | 1.0 /100 | #254 | Tragic 87.6% |
| Immigrants | Senegal | 0.9 /100 | #255 | Tragic 87.6% |
| Africans | 0.7 /100 | #256 | Tragic 87.5% |
| Bahamians | 0.7 /100 | #257 | Tragic 87.5% |
| Immigrants | Ghana | 0.5 /100 | #258 | Tragic 87.4% |
| Immigrants | Western Africa | 0.5 /100 | #259 | Tragic 87.4% |
| Cajuns | 0.4 /100 | #260 | Tragic 87.3% |
| Seminole | 0.4 /100 | #261 | Tragic 87.3% |
| Immigrants | Peru | 0.4 /100 | #262 | Tragic 87.3% |
| Immigrants | South Eastern Asia | 0.3 /100 | #263 | Tragic 87.2% |
| Jamaicans | 0.3 /100 | #264 | Tragic 87.2% |
Demographics Similar to Chippewa by High School Diploma
In terms of high school diploma, the demographic groups most similar to Chippewa are Immigrants from Bosnia and Herzegovina (89.8%, a difference of 0.050%), Albanian (89.8%, a difference of 0.050%), Immigrants from Jordan (89.8%, a difference of 0.050%), Immigrants from Italy (89.8%, a difference of 0.060%), and Ugandan (89.7%, a difference of 0.060%).
| Demographics | Rating | Rank | High School Diploma |
| Puget Sound Salish | 89.1 /100 | #128 | Excellent 89.9% |
| Basques | 88.5 /100 | #129 | Excellent 89.8% |
| Immigrants | Ukraine | 87.9 /100 | #130 | Excellent 89.8% |
| Immigrants | Italy | 87.4 /100 | #131 | Excellent 89.8% |
| Immigrants | Bosnia and Herzegovina | 87.3 /100 | #132 | Excellent 89.8% |
| Albanians | 87.2 /100 | #133 | Excellent 89.8% |
| Immigrants | Jordan | 87.2 /100 | #134 | Excellent 89.8% |
| Chippewa | 85.6 /100 | #135 | Excellent 89.7% |
| Ugandans | 83.7 /100 | #136 | Excellent 89.7% |
| Arabs | 83.6 /100 | #137 | Excellent 89.7% |
| Assyrians/Chaldeans/Syriacs | 82.5 /100 | #138 | Excellent 89.7% |
| Kenyans | 81.4 /100 | #139 | Excellent 89.6% |
| Immigrants | Egypt | 81.2 /100 | #140 | Excellent 89.6% |
| Chileans | 79.0 /100 | #141 | Good 89.6% |
| Indians (Asian) | 78.8 /100 | #142 | Good 89.6% |