Bahamian vs Basque High School Diploma
COMPARE
Bahamian
Basque
High School Diploma
High School Diploma Comparison
Bahamians
Basques
87.5%
HIGH SCHOOL DIPLOMA
0.7/ 100
METRIC RATING
257th/ 347
METRIC RANK
89.8%
HIGH SCHOOL DIPLOMA
88.5/ 100
METRIC RATING
129th/ 347
METRIC RANK
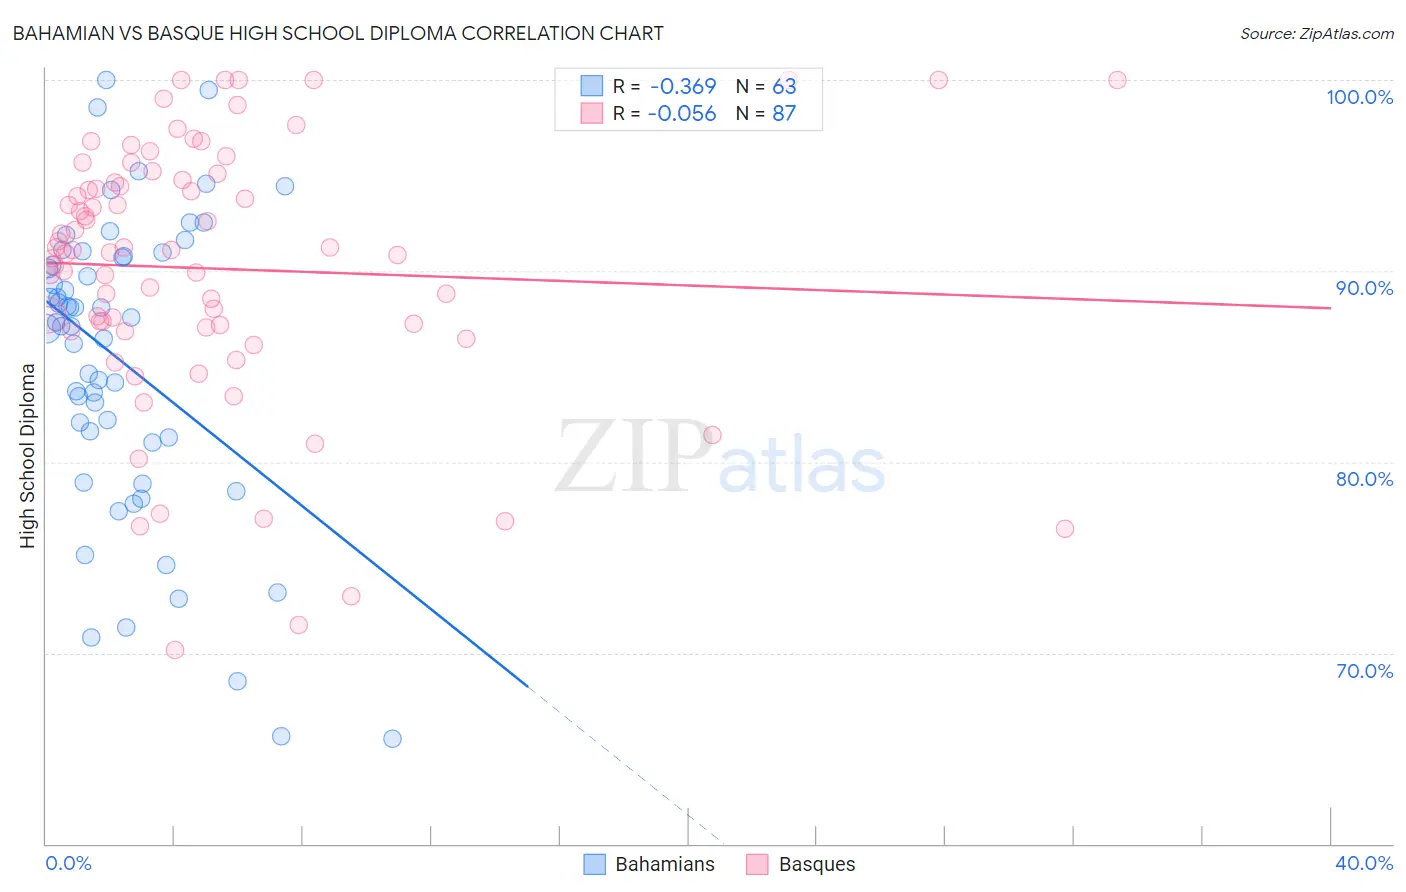
Bahamian vs Basque High School Diploma Correlation Chart
The statistical analysis conducted on geographies consisting of 112,698,819 people shows a mild negative correlation between the proportion of Bahamians and percentage of population with at least high school diploma education in the United States with a correlation coefficient (R) of -0.369 and weighted average of 87.5%. Similarly, the statistical analysis conducted on geographies consisting of 165,778,674 people shows a slight negative correlation between the proportion of Basques and percentage of population with at least high school diploma education in the United States with a correlation coefficient (R) of -0.056 and weighted average of 89.8%, a difference of 2.7%.
High School Diploma Correlation Summary
| Measurement | Bahamian | Basque |
| Minimum | 65.5% | 70.1% |
| Maximum | 100.0% | 100.0% |
| Range | 34.5% | 29.9% |
| Mean | 85.2% | 90.1% |
| Median | 87.1% | 91.1% |
| Interquartile 25% (IQ1) | 81.0% | 87.0% |
| Interquartile 75% (IQ3) | 90.8% | 94.7% |
| Interquartile Range (IQR) | 9.8% | 7.7% |
| Standard Deviation (Sample) | 7.9% | 6.8% |
| Standard Deviation (Population) | 7.9% | 6.8% |
Similar Demographics by High School Diploma
Demographics Similar to Bahamians by High School Diploma
In terms of high school diploma, the demographic groups most similar to Bahamians are African (87.5%, a difference of 0.0%), Immigrants from Senegal (87.6%, a difference of 0.10%), Immigrants from Ghana (87.4%, a difference of 0.10%), Immigrants from Western Africa (87.4%, a difference of 0.11%), and Immigrants from Colombia (87.6%, a difference of 0.16%).
| Demographics | Rating | Rank | High School Diploma |
| Immigrants | Nigeria | 1.5 /100 | #250 | Tragic 87.7% |
| Ghanaians | 1.4 /100 | #251 | Tragic 87.7% |
| Immigrants | South America | 1.2 /100 | #252 | Tragic 87.6% |
| Immigrants | Uruguay | 1.0 /100 | #253 | Tragic 87.6% |
| Immigrants | Colombia | 1.0 /100 | #254 | Tragic 87.6% |
| Immigrants | Senegal | 0.9 /100 | #255 | Tragic 87.6% |
| Africans | 0.7 /100 | #256 | Tragic 87.5% |
| Bahamians | 0.7 /100 | #257 | Tragic 87.5% |
| Immigrants | Ghana | 0.5 /100 | #258 | Tragic 87.4% |
| Immigrants | Western Africa | 0.5 /100 | #259 | Tragic 87.4% |
| Cajuns | 0.4 /100 | #260 | Tragic 87.3% |
| Seminole | 0.4 /100 | #261 | Tragic 87.3% |
| Immigrants | Peru | 0.4 /100 | #262 | Tragic 87.3% |
| Immigrants | South Eastern Asia | 0.3 /100 | #263 | Tragic 87.2% |
| Jamaicans | 0.3 /100 | #264 | Tragic 87.2% |
Demographics Similar to Basques by High School Diploma
In terms of high school diploma, the demographic groups most similar to Basques are Puget Sound Salish (89.9%, a difference of 0.020%), Immigrants from Ukraine (89.8%, a difference of 0.020%), Immigrants from Eastern Asia (89.9%, a difference of 0.030%), Immigrants from Italy (89.8%, a difference of 0.040%), and Immigrants from Bosnia and Herzegovina (89.8%, a difference of 0.040%).
| Demographics | Rating | Rank | High School Diploma |
| Immigrants | Kazakhstan | 93.4 /100 | #122 | Exceptional 90.0% |
| German Russians | 92.0 /100 | #123 | Exceptional 90.0% |
| Mongolians | 91.6 /100 | #124 | Exceptional 89.9% |
| Egyptians | 91.1 /100 | #125 | Exceptional 89.9% |
| Alaska Natives | 91.0 /100 | #126 | Exceptional 89.9% |
| Immigrants | Eastern Asia | 89.2 /100 | #127 | Excellent 89.9% |
| Puget Sound Salish | 89.1 /100 | #128 | Excellent 89.9% |
| Basques | 88.5 /100 | #129 | Excellent 89.8% |
| Immigrants | Ukraine | 87.9 /100 | #130 | Excellent 89.8% |
| Immigrants | Italy | 87.4 /100 | #131 | Excellent 89.8% |
| Immigrants | Bosnia and Herzegovina | 87.3 /100 | #132 | Excellent 89.8% |
| Albanians | 87.2 /100 | #133 | Excellent 89.8% |
| Immigrants | Jordan | 87.2 /100 | #134 | Excellent 89.8% |
| Chippewa | 85.6 /100 | #135 | Excellent 89.7% |
| Ugandans | 83.7 /100 | #136 | Excellent 89.7% |