Bahamian vs U.S. Virgin Islander Master's Degree
COMPARE
Bahamian
U.S. Virgin Islander
Master's Degree
Master's Degree Comparison
Bahamians
U.S. Virgin Islanders
12.4%
MASTER'S DEGREE
0.5/ 100
METRIC RATING
266th/ 347
METRIC RANK
13.1%
MASTER'S DEGREE
2.1/ 100
METRIC RATING
241st/ 347
METRIC RANK
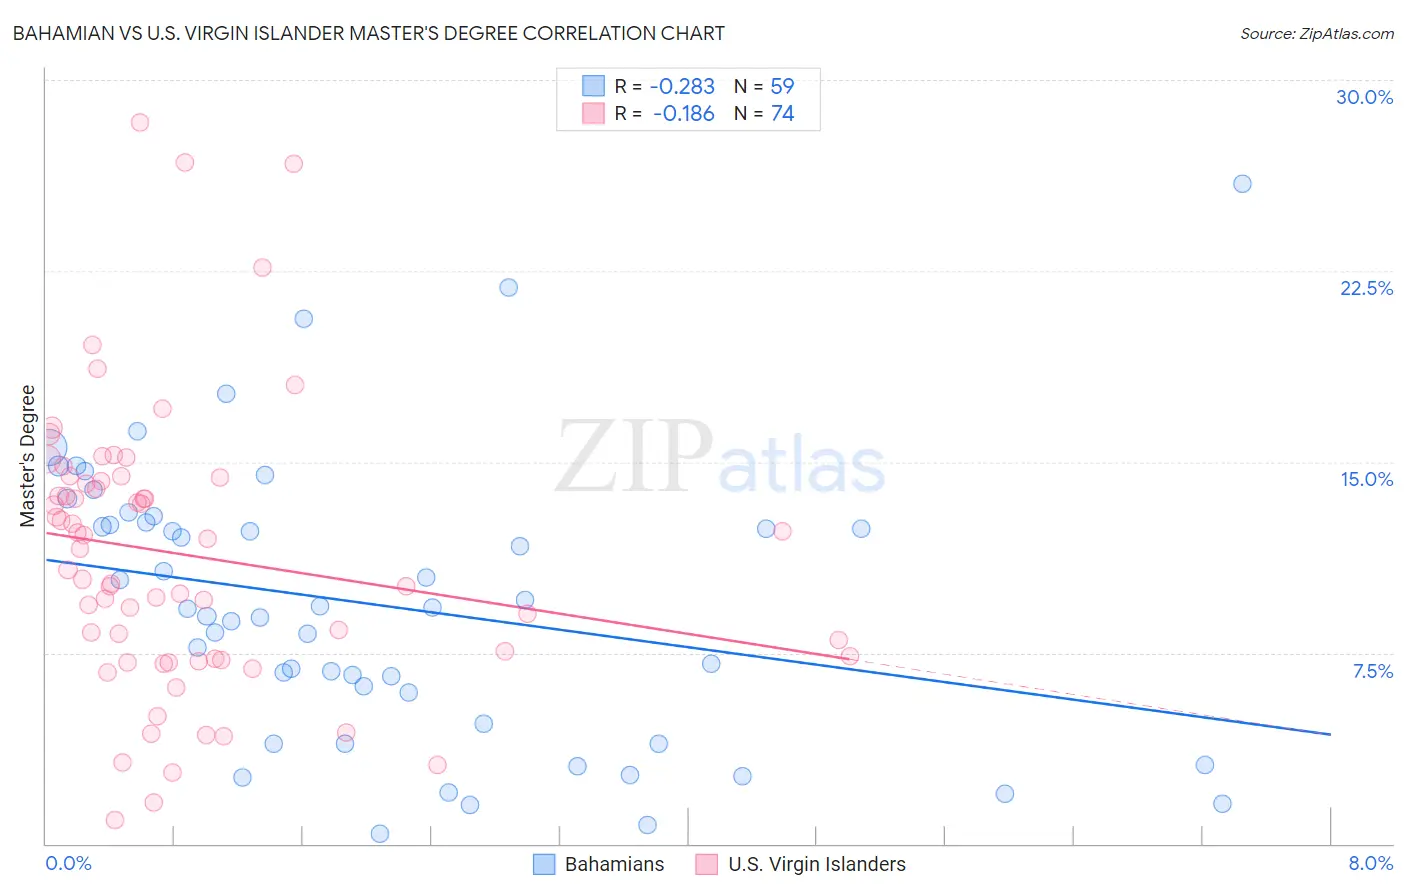
Bahamian vs U.S. Virgin Islander Master's Degree Correlation Chart
The statistical analysis conducted on geographies consisting of 112,667,548 people shows a weak negative correlation between the proportion of Bahamians and percentage of population with at least master's degree education in the United States with a correlation coefficient (R) of -0.283 and weighted average of 12.4%. Similarly, the statistical analysis conducted on geographies consisting of 87,520,164 people shows a poor negative correlation between the proportion of U.S. Virgin Islanders and percentage of population with at least master's degree education in the United States with a correlation coefficient (R) of -0.186 and weighted average of 13.1%, a difference of 5.5%.
Master's Degree Correlation Summary
| Measurement | Bahamian | U.S. Virgin Islander |
| Minimum | 0.39% | 0.93% |
| Maximum | 25.9% | 28.3% |
| Range | 25.5% | 27.4% |
| Mean | 9.4% | 11.4% |
| Median | 9.3% | 11.2% |
| Interquartile 25% (IQ1) | 4.7% | 7.2% |
| Interquartile 75% (IQ3) | 12.6% | 14.2% |
| Interquartile Range (IQR) | 7.9% | 7.0% |
| Standard Deviation (Sample) | 5.5% | 5.5% |
| Standard Deviation (Population) | 5.4% | 5.5% |
Similar Demographics by Master's Degree
Demographics Similar to Bahamians by Master's Degree
In terms of master's degree, the demographic groups most similar to Bahamians are Immigrants from Fiji (12.4%, a difference of 0.16%), Belizean (12.4%, a difference of 0.18%), Central American Indian (12.4%, a difference of 0.34%), Nicaraguan (12.5%, a difference of 0.58%), and Tongan (12.5%, a difference of 0.76%).
| Demographics | Rating | Rank | Master's Degree |
| Japanese | 0.6 /100 | #259 | Tragic 12.5% |
| Dominicans | 0.6 /100 | #260 | Tragic 12.5% |
| Tongans | 0.6 /100 | #261 | Tragic 12.5% |
| Nicaraguans | 0.6 /100 | #262 | Tragic 12.5% |
| Central American Indians | 0.5 /100 | #263 | Tragic 12.4% |
| Belizeans | 0.5 /100 | #264 | Tragic 12.4% |
| Immigrants | Fiji | 0.5 /100 | #265 | Tragic 12.4% |
| Bahamians | 0.5 /100 | #266 | Tragic 12.4% |
| Americans | 0.4 /100 | #267 | Tragic 12.3% |
| Native Hawaiians | 0.4 /100 | #268 | Tragic 12.3% |
| Central Americans | 0.3 /100 | #269 | Tragic 12.2% |
| Salvadorans | 0.3 /100 | #270 | Tragic 12.2% |
| Haitians | 0.3 /100 | #271 | Tragic 12.1% |
| Comanche | 0.3 /100 | #272 | Tragic 12.1% |
| Blackfeet | 0.3 /100 | #273 | Tragic 12.1% |
Demographics Similar to U.S. Virgin Islanders by Master's Degree
In terms of master's degree, the demographic groups most similar to U.S. Virgin Islanders are Guamanian/Chamorro (13.1%, a difference of 0.14%), Spanish American (13.0%, a difference of 0.28%), Immigrants from Jamaica (13.0%, a difference of 0.32%), Delaware (13.0%, a difference of 0.70%), and Immigrants from Bahamas (12.9%, a difference of 1.4%).
| Demographics | Rating | Rank | Master's Degree |
| Immigrants | Burma/Myanmar | 5.0 /100 | #234 | Tragic 13.5% |
| German Russians | 4.5 /100 | #235 | Tragic 13.5% |
| Immigrants | Guyana | 4.4 /100 | #236 | Tragic 13.4% |
| Jamaicans | 4.1 /100 | #237 | Tragic 13.4% |
| Hmong | 4.0 /100 | #238 | Tragic 13.4% |
| Immigrants | Nonimmigrants | 3.4 /100 | #239 | Tragic 13.3% |
| Guamanians/Chamorros | 2.2 /100 | #240 | Tragic 13.1% |
| U.S. Virgin Islanders | 2.1 /100 | #241 | Tragic 13.1% |
| Spanish Americans | 1.9 /100 | #242 | Tragic 13.0% |
| Immigrants | Jamaica | 1.9 /100 | #243 | Tragic 13.0% |
| Delaware | 1.7 /100 | #244 | Tragic 13.0% |
| Immigrants | Bahamas | 1.4 /100 | #245 | Tragic 12.9% |
| Immigrants | Cambodia | 1.4 /100 | #246 | Tragic 12.9% |
| Iroquois | 1.4 /100 | #247 | Tragic 12.9% |
| Africans | 1.4 /100 | #248 | Tragic 12.9% |