Menominee vs Immigrants from Czechoslovakia Master's Degree

COMPARE

Menominee
Race
Ancestry
AfghanAfricanAlaska NativeAlaskan AthabascanAlbanianAleutAlsatianAmericanApacheArabArapahoArgentineanArmenianAssyrian/Chaldean/SyriacAustralianAustrianBahamianBangladeshiBarbadianBasqueBelgianBelizeanBermudanBhutaneseBlackfeetBolivianBrazilianBritishBritish West IndianBulgarianBurmeseCajunCambodianCanadianCape VerdeanCarpatho RusynCelticCentral AmericanCentral American IndianCherokeeCheyenneChickasawChileanChineseChippewaChoctawColombianColvilleComancheCosta RicanCreeCreekCroatianCrowCubanCypriotCzechCzechoslovakianDanishDelawareDominicanDutchDutch West IndianEastern EuropeanEcuadorianEgyptianEnglishEstonianEthiopianEuropeanFijianFilipinoFinnishFrenchFrench American IndianFrench CanadianGermanGerman RussianGhanaianGreekGuamanian/ChamorroGuatemalanGuyaneseHaitianHmongHonduranHopiHoumaHungarianIcelanderIndian (Asian)IndonesianInupiatIranianIraqiIrishIroquoisIsraeliItalianJamaicanJapaneseJordanianKenyanKiowaKoreanLaotianLatvianLebaneseLiberianLithuanianLumbeeLuxembourgerMacedonianMalaysianMalteseMarshalleseMenomineeMexicanMexican American IndianMongolianMoroccanNative HawaiianNavajoNepaleseNew ZealanderNicaraguanNigerianNorthern EuropeanNorwegianOkinawanOsageOttawaPaiutePakistaniPalestinianPanamanianParaguayanPennsylvania GermanPeruvianPimaPolishPortuguesePotawatomiPuebloPuerto RicanPuget Sound SalishRomanianRussianSalvadoranSamoanScandinavianScotch-IrishScottishSeminoleSenegaleseSerbianShoshoneSierra LeoneanSiouxSlavicSlovakSloveneSomaliSouth AfricanSouth AmericanSouth American IndianSoviet UnionSpaniardSpanishSpanish AmericanSpanish American IndianSri LankanSubsaharan AfricanSudaneseSwedishSwissSyrianTaiwaneseThaiTlingit-HaidaTohono O'OdhamTonganTrinidadian and TobagonianTsimshianTurkishU.S. Virgin IslanderUgandanUkrainianUruguayanUteVenezuelanVietnameseWelshWest IndianYakamaYaquiYugoslavianYumanYup'ikZimbabwean
Immigration
NonimmigrantsImmigrantsAfghanistanAfricaAlbaniaArgentinaArmeniaAsiaAustraliaAustriaBahamasBangladeshBarbadosBelarusBelgiumBelizeBoliviaBosnia and HerzegovinaBrazilBulgariaBurma/MyanmarCabo VerdeCambodiaCameroonCanadaCaribbeanCentral AmericaChileChinaColombiaCongoCosta RicaCroatiaCubaDenmarkDominicaDominican RepublicEastern AfricaEastern AsiaEastern EuropeEcuadorEgyptEl SalvadorEnglandEritreaEthiopiaEuropeFijiFranceGermanyGhanaGreeceGrenadaGuatemalaGuyanaHaitiHondurasHong KongHungaryIndiaIndonesiaIranIraqIrelandIsraelItalyJamaicaJapanJordanKazakhstanKenyaKoreaKuwaitLaosLatin AmericaLatviaLebanonLiberiaLithuaniaMalaysiaMexicoMicronesiaMiddle AfricaMoldovaMoroccoNepalNetherlandsNicaraguaNigeriaNorth AmericaNorth MacedoniaNorthern AfricaNorthern EuropeNorwayOceaniaPakistanPanamaPeruPhilippinesPolandPortugalRomaniaRussiaSaudi ArabiaScotlandSenegalSerbiaSierra LeoneSingaporeSomaliaSouth AfricaSouth AmericaSouth Central AsiaSouth Eastern AsiaSouthern EuropeSpainSri LankaSt. Vincent and the GrenadinesSudanSwedenSwitzerlandSyriaTaiwanThailandTrinidad and TobagoTurkeyUgandaUkraineUruguayUzbekistanVenezuelaVietnamWest IndiesWestern AfricaWestern AsiaWestern EuropeYemenZaireZimbabweAzores
Immigrants from Czechoslovakia
Race
Ancestry
AfghanAfricanAlaska NativeAlaskan AthabascanAlbanianAleutAlsatianAmericanApacheArabArapahoArgentineanArmenianAssyrian/Chaldean/SyriacAustralianAustrianBahamianBangladeshiBarbadianBasqueBelgianBelizeanBermudanBhutaneseBlackfeetBolivianBrazilianBritishBritish West IndianBulgarianBurmeseCajunCambodianCanadianCape VerdeanCarpatho RusynCelticCentral AmericanCentral American IndianCherokeeCheyenneChickasawChileanChineseChippewaChoctawColombianColvilleComancheCosta RicanCreeCreekCroatianCrowCubanCypriotCzechCzechoslovakianDanishDelawareDominicanDutchDutch West IndianEastern EuropeanEcuadorianEgyptianEnglishEstonianEthiopianEuropeanFijianFilipinoFinnishFrenchFrench American IndianFrench CanadianGermanGerman RussianGhanaianGreekGuamanian/ChamorroGuatemalanGuyaneseHaitianHmongHonduranHopiHoumaHungarianIcelanderIndian (Asian)IndonesianInupiatIranianIraqiIrishIroquoisIsraeliItalianJamaicanJapaneseJordanianKenyanKiowaKoreanLaotianLatvianLebaneseLiberianLithuanianLumbeeLuxembourgerMacedonianMalaysianMalteseMarshalleseMexicanMexican American IndianMongolianMoroccanNative HawaiianNavajoNepaleseNew ZealanderNicaraguanNigerianNorthern EuropeanNorwegianOkinawanOsageOttawaPaiutePakistaniPalestinianPanamanianParaguayanPennsylvania GermanPeruvianPimaPolishPortuguesePotawatomiPuebloPuerto RicanPuget Sound SalishRomanianRussianSalvadoranSamoanScandinavianScotch-IrishScottishSeminoleSenegaleseSerbianShoshoneSierra LeoneanSiouxSlavicSlovakSloveneSomaliSouth AfricanSouth AmericanSouth American IndianSoviet UnionSpaniardSpanishSpanish AmericanSpanish American IndianSri LankanSubsaharan AfricanSudaneseSwedishSwissSyrianTaiwaneseThaiTlingit-HaidaTohono O'OdhamTonganTrinidadian and TobagonianTsimshianTurkishU.S. Virgin IslanderUgandanUkrainianUruguayanUteVenezuelanVietnameseWelshWest IndianYakamaYaquiYugoslavianYumanYup'ikZimbabwean
Immigration
NonimmigrantsImmigrantsAfghanistanAfricaAlbaniaArgentinaArmeniaAsiaAustraliaAustriaBahamasBangladeshBarbadosBelarusBelgiumBelizeBoliviaBosnia and HerzegovinaBrazilBulgariaBurma/MyanmarCabo VerdeCambodiaCameroonCanadaCaribbeanCentral AmericaChileChinaColombiaCongoCosta RicaCroatiaCubaCzechoslovakiaDenmarkDominicaDominican RepublicEastern AfricaEastern AsiaEastern EuropeEcuadorEgyptEl SalvadorEnglandEritreaEthiopiaEuropeFijiFranceGermanyGhanaGreeceGrenadaGuatemalaGuyanaHaitiHondurasHong KongHungaryIndiaIndonesiaIranIraqIrelandIsraelItalyJamaicaJapanJordanKazakhstanKenyaKoreaKuwaitLaosLatin AmericaLatviaLebanonLiberiaLithuaniaMalaysiaMexicoMicronesiaMiddle AfricaMoldovaMoroccoNepalNetherlandsNicaraguaNigeriaNorth AmericaNorth MacedoniaNorthern AfricaNorthern EuropeNorwayOceaniaPakistanPanamaPeruPhilippinesPolandPortugalRomaniaRussiaSaudi ArabiaScotlandSenegalSerbiaSierra LeoneSingaporeSomaliaSouth AfricaSouth AmericaSouth Central AsiaSouth Eastern AsiaSouthern EuropeSpainSri LankaSt. Vincent and the GrenadinesSudanSwedenSwitzerlandSyriaTaiwanThailandTrinidad and TobagoTurkeyUgandaUkraineUruguayUzbekistanVenezuelaVietnamWest IndiesWestern AfricaWestern AsiaWestern EuropeYemenZaireZimbabweAzores
Master's Degree
Income
Poverty
Unemployment
Labor Participation
Family Structure
Vehicle Availability
Education Level
Disability

Master's Degree Comparison

Menominee

Immigrants from Czechoslovakia

Tragic
Exceptional
10.2%
MASTER'S DEGREE
0.0/ 100
METRIC RATING
333rd/ 347
METRIC RANK
18.5%
MASTER'S DEGREE
99.9/ 100
METRIC RATING
53rd/ 347
METRIC RANK

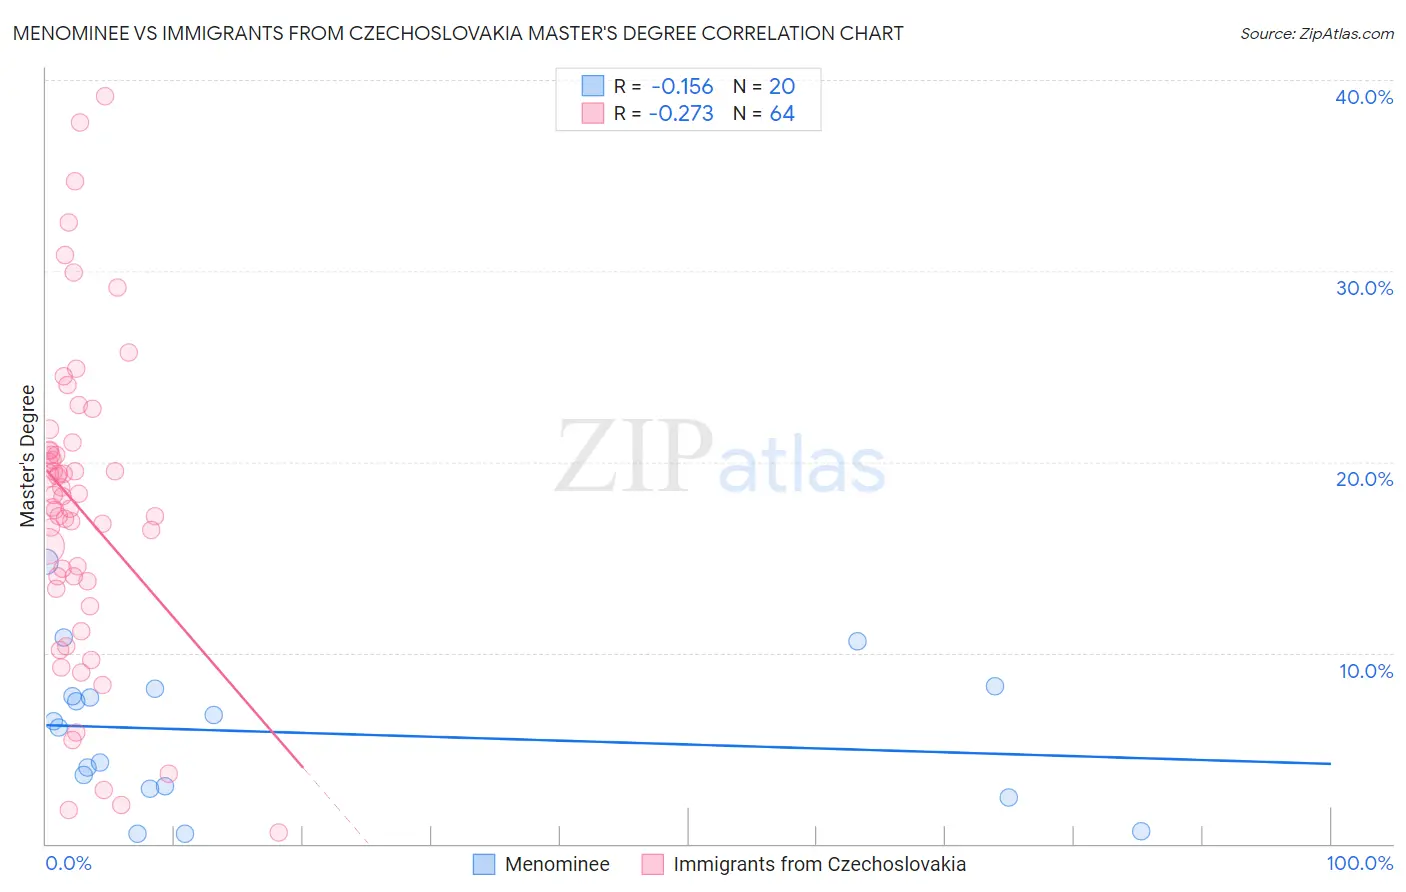
Menominee vs Immigrants from Czechoslovakia Master's Degree Correlation Chart

The statistical analysis conducted on geographies consisting of 45,774,171 people shows a poor negative correlation between the proportion of Menominee and percentage of population with at least master's degree education in the United States with a correlation coefficient (R) of -0.156 and weighted average of 10.2%. Similarly, the statistical analysis conducted on geographies consisting of 195,445,199 people shows a weak negative correlation between the proportion of Immigrants from Czechoslovakia and percentage of population with at least master's degree education in the United States with a correlation coefficient (R) of -0.273 and weighted average of 18.5%, a difference of 82.0%.
Menominee vs Immigrants from Czechoslovakia Master's Degree

Master's Degree Correlation Summary

MeasurementMenomineeImmigrants from Czechoslovakia
Minimum0.53%0.60%
Maximum14.8%39.2%
Range14.2%38.6%
Mean5.8%17.6%
Median6.3%17.9%
Interquartile 25% (IQ1)2.9%13.6%
Interquartile 75% (IQ3)7.9%20.6%
Interquartile Range (IQR)5.0%7.0%
Standard Deviation (Sample)3.8%8.2%
Standard Deviation (Population)3.7%8.1%

Similar Demographics by Master's Degree

Demographics Similar to Menominee by Master's Degree

In terms of master's degree, the demographic groups most similar to Menominee are Immigrants from the Azores (10.2%, a difference of 0.37%), Pueblo (10.3%, a difference of 0.83%), Fijian (10.3%, a difference of 1.0%), Arapaho (10.0%, a difference of 1.9%), and Immigrants from Central America (10.0%, a difference of 2.1%).
DemographicsRating | RankMaster's Degree
Creek
0.0
/100
|
#326
Tragic
10.5%
Paiute
0.0
/100
|
#327
Tragic
10.5%
Bangladeshis
0.0
/100
|
#328
Tragic
10.5%
Nepalese
0.0
/100
|
#329
Tragic
10.5%
Fijians
0.0
/100
|
#330
Tragic
10.3%
Pueblo
0.0
/100
|
#331
Tragic
10.3%
Immigrants | Azores
0.0
/100
|
#332
Tragic
10.2%
Menominee
0.0
/100
|
#333
Tragic
10.2%
Arapaho
0.0
/100
|
#334
Tragic
10.0%
Immigrants | Central America
0.0
/100
|
#335
Tragic
10.0%
Natives/Alaskans
0.0
/100
|
#336
Tragic
9.9%
Mexicans
0.0
/100
|
#337
Tragic
9.7%
Tohono O'odham
0.0
/100
|
#338
Tragic
9.7%
Spanish American Indians
0.0
/100
|
#339
Tragic
9.6%
Yakama
0.0
/100
|
#340
Tragic
9.5%

Demographics Similar to Immigrants from Czechoslovakia by Master's Degree

In terms of master's degree, the demographic groups most similar to Immigrants from Czechoslovakia are Immigrants from Kuwait (18.6%, a difference of 0.080%), Immigrants from Lithuania (18.5%, a difference of 0.31%), Immigrants from Serbia (18.5%, a difference of 0.34%), Asian (18.4%, a difference of 0.57%), and Immigrants from Asia (18.4%, a difference of 0.70%).
DemographicsRating | RankMaster's Degree
Immigrants | Norway
100.0
/100
|
#46
Exceptional
18.8%
Immigrants | Austria
100.0
/100
|
#47
Exceptional
18.8%
Paraguayans
100.0
/100
|
#48
Exceptional
18.8%
Estonians
100.0
/100
|
#49
Exceptional
18.8%
Bulgarians
100.0
/100
|
#50
Exceptional
18.8%
Immigrants | South Africa
100.0
/100
|
#51
Exceptional
18.8%
Immigrants | Kuwait
100.0
/100
|
#52
Exceptional
18.6%
Immigrants | Czechoslovakia
99.9
/100
|
#53
Exceptional
18.5%
Immigrants | Lithuania
99.9
/100
|
#54
Exceptional
18.5%
Immigrants | Serbia
99.9
/100
|
#55
Exceptional
18.5%
Asians
99.9
/100
|
#56
Exceptional
18.4%
Immigrants | Asia
99.9
/100
|
#57
Exceptional
18.4%
Australians
99.9
/100
|
#58
Exceptional
18.4%
Immigrants | Bulgaria
99.9
/100
|
#59
Exceptional
18.3%
New Zealanders
99.9
/100
|
#60
Exceptional
18.3%