Bahamian vs Immigrants from Moldova College, 1 year or more
COMPARE
Bahamian
Immigrants from Moldova
College, 1 year or more
College, 1 year or more Comparison
Bahamians
Immigrants from Moldova
54.5%
COLLEGE, 1 YEAR OR MORE
0.2/ 100
METRIC RATING
271st/ 347
METRIC RANK
63.0%
COLLEGE, 1 YEAR OR MORE
99.0/ 100
METRIC RATING
73rd/ 347
METRIC RANK
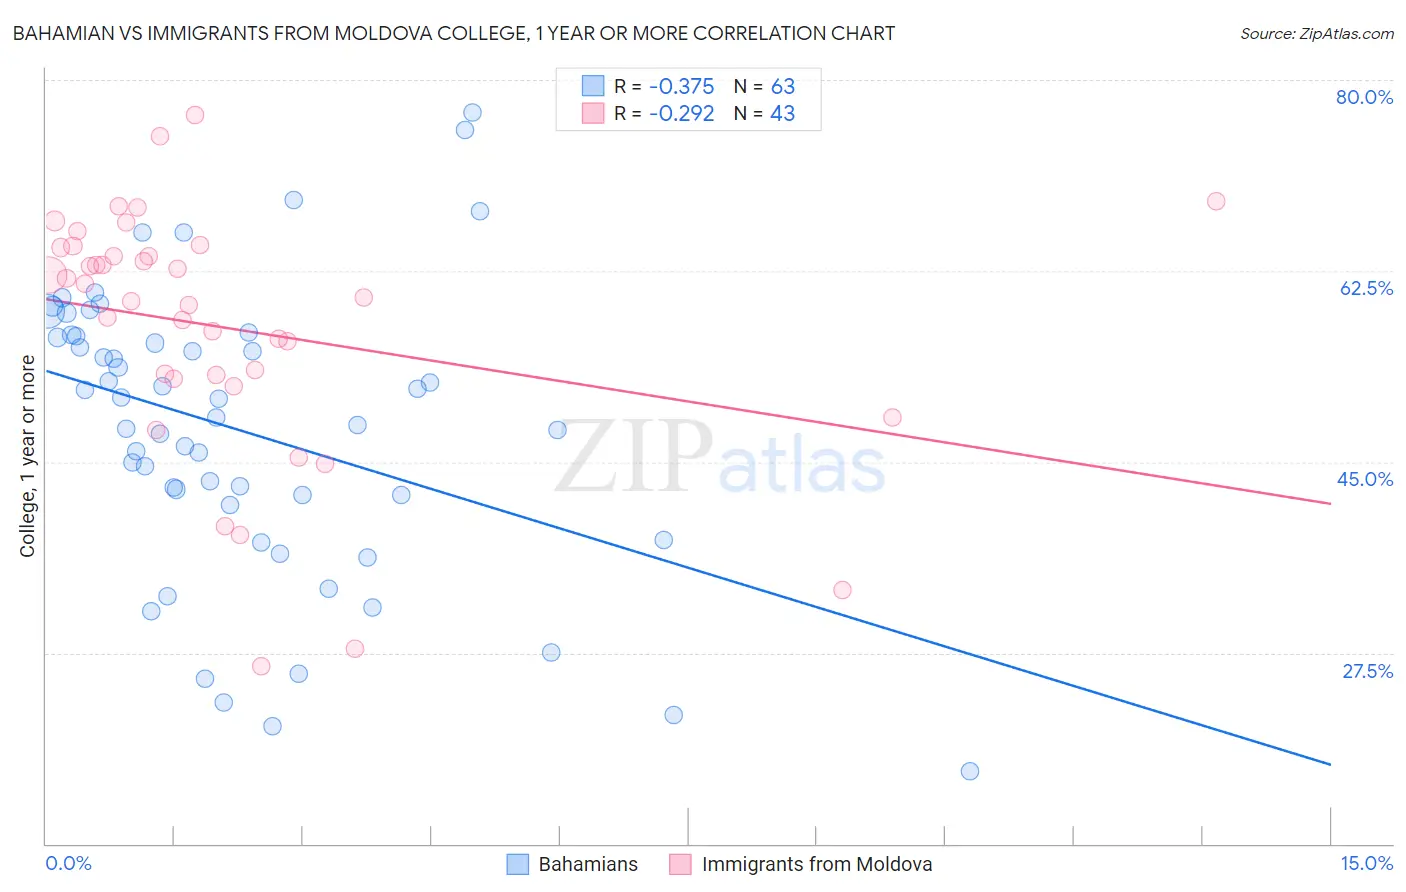
Bahamian vs Immigrants from Moldova College, 1 year or more Correlation Chart
The statistical analysis conducted on geographies consisting of 112,705,508 people shows a mild negative correlation between the proportion of Bahamians and percentage of population with at least college, 1 year or more education in the United States with a correlation coefficient (R) of -0.375 and weighted average of 54.5%. Similarly, the statistical analysis conducted on geographies consisting of 124,398,509 people shows a weak negative correlation between the proportion of Immigrants from Moldova and percentage of population with at least college, 1 year or more education in the United States with a correlation coefficient (R) of -0.292 and weighted average of 63.0%, a difference of 15.7%.
College, 1 year or more Correlation Summary
| Measurement | Bahamian | Immigrants from Moldova |
| Minimum | 16.6% | 26.3% |
| Maximum | 77.1% | 76.8% |
| Range | 60.4% | 50.4% |
| Mean | 47.8% | 57.2% |
| Median | 49.1% | 60.0% |
| Interquartile 25% (IQ1) | 41.0% | 52.7% |
| Interquartile 75% (IQ3) | 56.5% | 64.6% |
| Interquartile Range (IQR) | 15.5% | 12.0% |
| Standard Deviation (Sample) | 13.3% | 11.4% |
| Standard Deviation (Population) | 13.2% | 11.3% |
Similar Demographics by College, 1 year or more
Demographics Similar to Bahamians by College, 1 year or more
In terms of college, 1 year or more, the demographic groups most similar to Bahamians are Crow (54.5%, a difference of 0.020%), Comanche (54.4%, a difference of 0.050%), Bangladeshi (54.5%, a difference of 0.060%), Immigrants from Grenada (54.4%, a difference of 0.080%), and British West Indian (54.5%, a difference of 0.090%).
| Demographics | Rating | Rank | College, 1 year or more |
| Immigrants | Micronesia | 0.3 /100 | #264 | Tragic 54.8% |
| Immigrants | Laos | 0.2 /100 | #265 | Tragic 54.7% |
| Potawatomi | 0.2 /100 | #266 | Tragic 54.6% |
| Blackfeet | 0.2 /100 | #267 | Tragic 54.6% |
| British West Indians | 0.2 /100 | #268 | Tragic 54.5% |
| Bangladeshis | 0.2 /100 | #269 | Tragic 54.5% |
| Crow | 0.2 /100 | #270 | Tragic 54.5% |
| Bahamians | 0.2 /100 | #271 | Tragic 54.5% |
| Comanche | 0.2 /100 | #272 | Tragic 54.4% |
| Immigrants | Grenada | 0.2 /100 | #273 | Tragic 54.4% |
| Belizeans | 0.2 /100 | #274 | Tragic 54.4% |
| Americans | 0.2 /100 | #275 | Tragic 54.4% |
| Shoshone | 0.2 /100 | #276 | Tragic 54.3% |
| Ecuadorians | 0.2 /100 | #277 | Tragic 54.3% |
| Immigrants | Jamaica | 0.1 /100 | #278 | Tragic 54.2% |
Demographics Similar to Immigrants from Moldova by College, 1 year or more
In terms of college, 1 year or more, the demographic groups most similar to Immigrants from Moldova are Egyptian (63.1%, a difference of 0.010%), Immigrants from North America (63.0%, a difference of 0.020%), Immigrants from Canada (63.1%, a difference of 0.070%), Armenian (63.0%, a difference of 0.11%), and Paraguayan (62.9%, a difference of 0.21%).
| Demographics | Rating | Rank | College, 1 year or more |
| Immigrants | Europe | 99.3 /100 | #66 | Exceptional 63.3% |
| Immigrants | Romania | 99.3 /100 | #67 | Exceptional 63.3% |
| Immigrants | Greece | 99.3 /100 | #68 | Exceptional 63.3% |
| Immigrants | Zimbabwe | 99.3 /100 | #69 | Exceptional 63.3% |
| Argentineans | 99.2 /100 | #70 | Exceptional 63.2% |
| Immigrants | Canada | 99.1 /100 | #71 | Exceptional 63.1% |
| Egyptians | 99.0 /100 | #72 | Exceptional 63.1% |
| Immigrants | Moldova | 99.0 /100 | #73 | Exceptional 63.0% |
| Immigrants | North America | 99.0 /100 | #74 | Exceptional 63.0% |
| Armenians | 98.9 /100 | #75 | Exceptional 63.0% |
| Paraguayans | 98.8 /100 | #76 | Exceptional 62.9% |
| Ethiopians | 98.8 /100 | #77 | Exceptional 62.9% |
| Immigrants | Lebanon | 98.8 /100 | #78 | Exceptional 62.9% |
| Northern Europeans | 98.8 /100 | #79 | Exceptional 62.9% |
| Lithuanians | 98.8 /100 | #80 | Exceptional 62.9% |