Bahamian vs Immigrants from Afghanistan College, 1 year or more
COMPARE
Bahamian
Immigrants from Afghanistan
College, 1 year or more
College, 1 year or more Comparison
Bahamians
Immigrants from Afghanistan
54.5%
COLLEGE, 1 YEAR OR MORE
0.2/ 100
METRIC RATING
271st/ 347
METRIC RANK
60.7%
COLLEGE, 1 YEAR OR MORE
83.1/ 100
METRIC RATING
141st/ 347
METRIC RANK
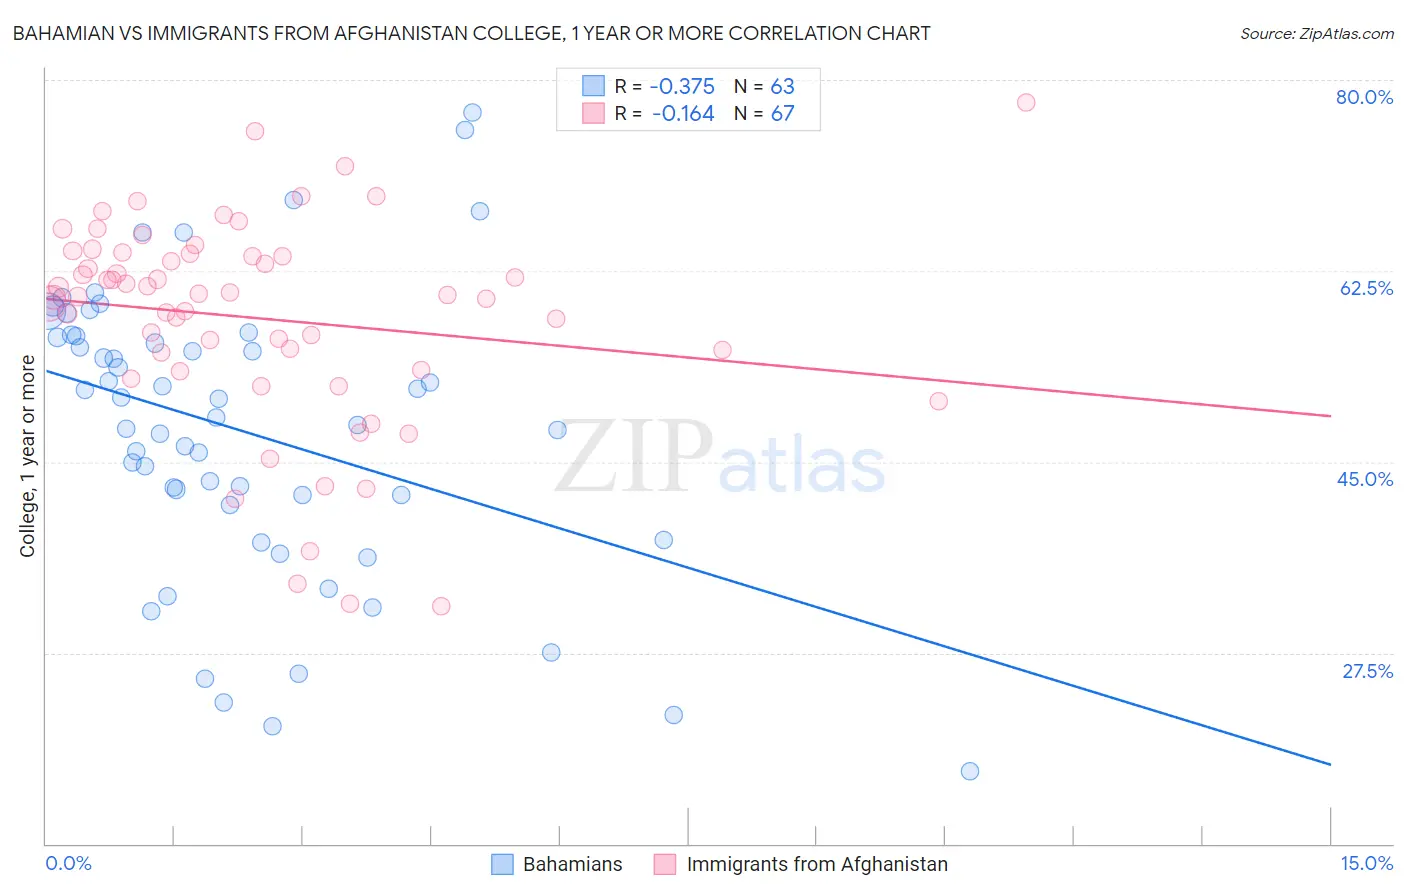
Bahamian vs Immigrants from Afghanistan College, 1 year or more Correlation Chart
The statistical analysis conducted on geographies consisting of 112,705,508 people shows a mild negative correlation between the proportion of Bahamians and percentage of population with at least college, 1 year or more education in the United States with a correlation coefficient (R) of -0.375 and weighted average of 54.5%. Similarly, the statistical analysis conducted on geographies consisting of 147,646,040 people shows a poor negative correlation between the proportion of Immigrants from Afghanistan and percentage of population with at least college, 1 year or more education in the United States with a correlation coefficient (R) of -0.164 and weighted average of 60.7%, a difference of 11.4%.
College, 1 year or more Correlation Summary
| Measurement | Bahamian | Immigrants from Afghanistan |
| Minimum | 16.6% | 31.8% |
| Maximum | 77.1% | 78.0% |
| Range | 60.4% | 46.2% |
| Mean | 47.8% | 58.2% |
| Median | 49.1% | 60.3% |
| Interquartile 25% (IQ1) | 41.0% | 53.4% |
| Interquartile 75% (IQ3) | 56.5% | 64.1% |
| Interquartile Range (IQR) | 15.5% | 10.7% |
| Standard Deviation (Sample) | 13.3% | 9.6% |
| Standard Deviation (Population) | 13.2% | 9.5% |
Similar Demographics by College, 1 year or more
Demographics Similar to Bahamians by College, 1 year or more
In terms of college, 1 year or more, the demographic groups most similar to Bahamians are Crow (54.5%, a difference of 0.020%), Comanche (54.4%, a difference of 0.050%), Bangladeshi (54.5%, a difference of 0.060%), Immigrants from Grenada (54.4%, a difference of 0.080%), and British West Indian (54.5%, a difference of 0.090%).
| Demographics | Rating | Rank | College, 1 year or more |
| Immigrants | Micronesia | 0.3 /100 | #264 | Tragic 54.8% |
| Immigrants | Laos | 0.2 /100 | #265 | Tragic 54.7% |
| Potawatomi | 0.2 /100 | #266 | Tragic 54.6% |
| Blackfeet | 0.2 /100 | #267 | Tragic 54.6% |
| British West Indians | 0.2 /100 | #268 | Tragic 54.5% |
| Bangladeshis | 0.2 /100 | #269 | Tragic 54.5% |
| Crow | 0.2 /100 | #270 | Tragic 54.5% |
| Bahamians | 0.2 /100 | #271 | Tragic 54.5% |
| Comanche | 0.2 /100 | #272 | Tragic 54.4% |
| Immigrants | Grenada | 0.2 /100 | #273 | Tragic 54.4% |
| Belizeans | 0.2 /100 | #274 | Tragic 54.4% |
| Americans | 0.2 /100 | #275 | Tragic 54.4% |
| Shoshone | 0.2 /100 | #276 | Tragic 54.3% |
| Ecuadorians | 0.2 /100 | #277 | Tragic 54.3% |
| Immigrants | Jamaica | 0.1 /100 | #278 | Tragic 54.2% |
Demographics Similar to Immigrants from Afghanistan by College, 1 year or more
In terms of college, 1 year or more, the demographic groups most similar to Immigrants from Afghanistan are Iraqi (60.7%, a difference of 0.020%), Polish (60.7%, a difference of 0.030%), Canadian (60.6%, a difference of 0.040%), Taiwanese (60.7%, a difference of 0.11%), and Immigrants from Eritrea (60.7%, a difference of 0.11%).
| Demographics | Rating | Rank | College, 1 year or more |
| Immigrants | Venezuela | 87.9 /100 | #134 | Excellent 61.0% |
| Immigrants | Uganda | 87.4 /100 | #135 | Excellent 60.9% |
| Basques | 87.2 /100 | #136 | Excellent 60.9% |
| Slovenes | 86.5 /100 | #137 | Excellent 60.9% |
| Taiwanese | 84.3 /100 | #138 | Excellent 60.7% |
| Immigrants | Eritrea | 84.3 /100 | #139 | Excellent 60.7% |
| Iraqis | 83.3 /100 | #140 | Excellent 60.7% |
| Immigrants | Afghanistan | 83.1 /100 | #141 | Excellent 60.7% |
| Poles | 82.8 /100 | #142 | Excellent 60.7% |
| Canadians | 82.7 /100 | #143 | Excellent 60.6% |
| Czechs | 81.9 /100 | #144 | Excellent 60.6% |
| Slavs | 81.1 /100 | #145 | Excellent 60.6% |
| Scottish | 80.2 /100 | #146 | Excellent 60.5% |
| Immigrants | Kenya | 79.1 /100 | #147 | Good 60.5% |
| Kenyans | 79.0 /100 | #148 | Good 60.5% |