Immigrants from Ecuador vs Carpatho Rusyn College, 1 year or more
COMPARE
Immigrants from Ecuador
Carpatho Rusyn
College, 1 year or more
College, 1 year or more Comparison
Immigrants from Ecuador
Carpatho Rusyns
53.4%
COLLEGE, 1 YEAR OR MORE
0.0/ 100
METRIC RATING
289th/ 347
METRIC RANK
62.2%
COLLEGE, 1 YEAR OR MORE
97.2/ 100
METRIC RATING
98th/ 347
METRIC RANK
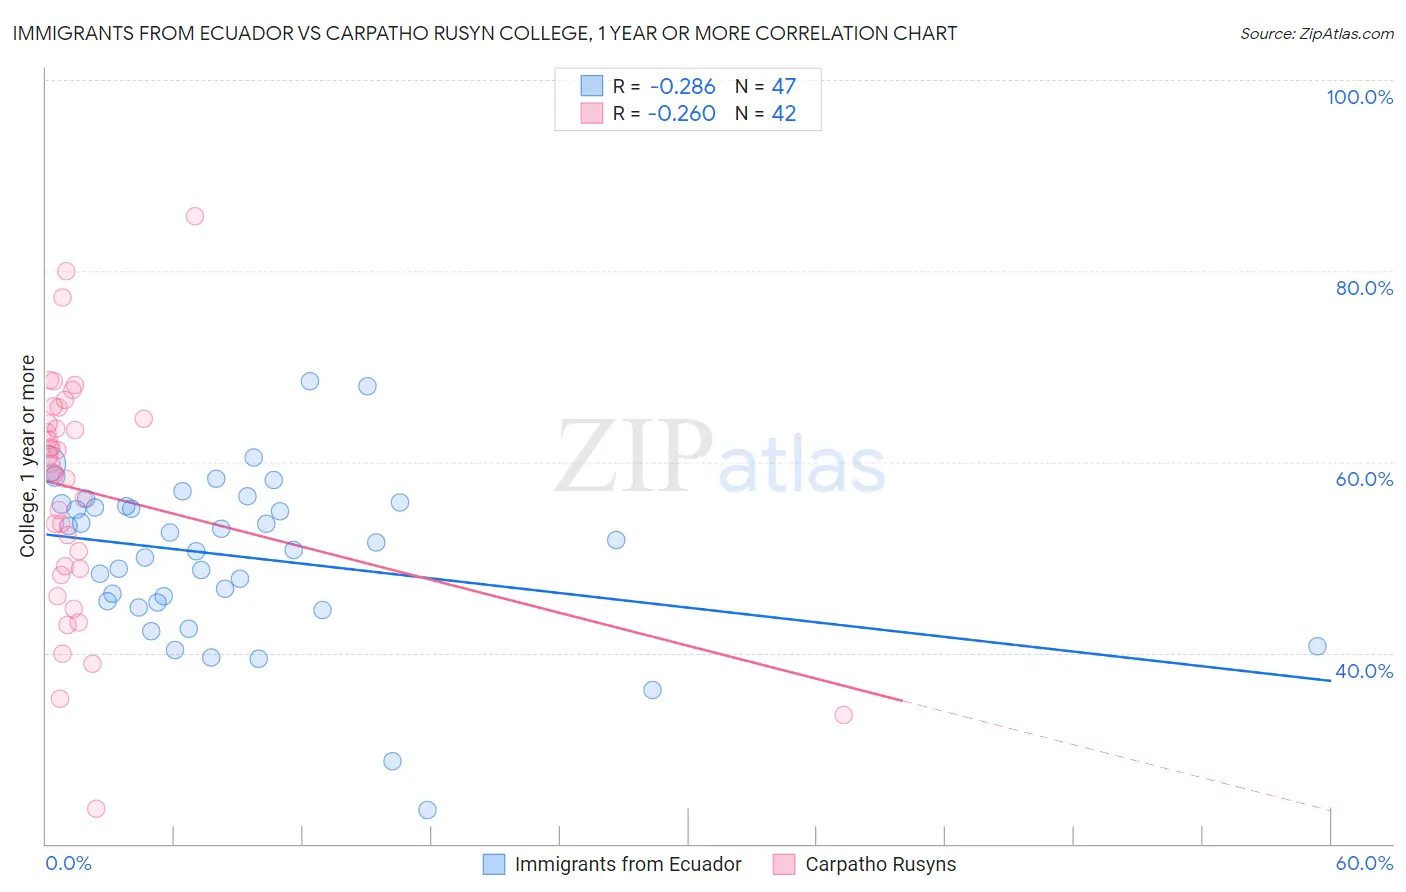
Immigrants from Ecuador vs Carpatho Rusyn College, 1 year or more Correlation Chart
The statistical analysis conducted on geographies consisting of 271,020,679 people shows a weak negative correlation between the proportion of Immigrants from Ecuador and percentage of population with at least college, 1 year or more education in the United States with a correlation coefficient (R) of -0.286 and weighted average of 53.4%. Similarly, the statistical analysis conducted on geographies consisting of 58,871,690 people shows a weak negative correlation between the proportion of Carpatho Rusyns and percentage of population with at least college, 1 year or more education in the United States with a correlation coefficient (R) of -0.260 and weighted average of 62.2%, a difference of 16.4%.
College, 1 year or more Correlation Summary
| Measurement | Immigrants from Ecuador | Carpatho Rusyn |
| Minimum | 23.5% | 23.7% |
| Maximum | 68.5% | 85.7% |
| Range | 44.9% | 62.1% |
| Mean | 50.1% | 56.9% |
| Median | 51.6% | 59.4% |
| Interquartile 25% (IQ1) | 45.2% | 48.8% |
| Interquartile 75% (IQ3) | 55.6% | 64.5% |
| Interquartile Range (IQR) | 10.4% | 15.6% |
| Standard Deviation (Sample) | 8.7% | 12.7% |
| Standard Deviation (Population) | 8.6% | 12.5% |
Similar Demographics by College, 1 year or more
Demographics Similar to Immigrants from Ecuador by College, 1 year or more
In terms of college, 1 year or more, the demographic groups most similar to Immigrants from Ecuador are Alaska Native (53.4%, a difference of 0.0%), Alaskan Athabascan (53.4%, a difference of 0.020%), Cuban (53.4%, a difference of 0.070%), Immigrants from Belize (53.5%, a difference of 0.17%), and Chickasaw (53.3%, a difference of 0.20%).
| Demographics | Rating | Rank | College, 1 year or more |
| Guyanese | 0.1 /100 | #282 | Tragic 54.1% |
| Nicaraguans | 0.1 /100 | #283 | Tragic 53.9% |
| Ute | 0.1 /100 | #284 | Tragic 53.8% |
| Immigrants | Guyana | 0.1 /100 | #285 | Tragic 53.5% |
| Central American Indians | 0.1 /100 | #286 | Tragic 53.5% |
| Immigrants | Belize | 0.1 /100 | #287 | Tragic 53.5% |
| Alaska Natives | 0.0 /100 | #288 | Tragic 53.4% |
| Immigrants | Ecuador | 0.0 /100 | #289 | Tragic 53.4% |
| Alaskan Athabascans | 0.0 /100 | #290 | Tragic 53.4% |
| Cubans | 0.0 /100 | #291 | Tragic 53.4% |
| Chickasaw | 0.0 /100 | #292 | Tragic 53.3% |
| Blacks/African Americans | 0.0 /100 | #293 | Tragic 53.3% |
| Cherokee | 0.0 /100 | #294 | Tragic 53.2% |
| Yaqui | 0.0 /100 | #295 | Tragic 53.2% |
| Sioux | 0.0 /100 | #296 | Tragic 53.0% |
Demographics Similar to Carpatho Rusyns by College, 1 year or more
In terms of college, 1 year or more, the demographic groups most similar to Carpatho Rusyns are Jordanian (62.2%, a difference of 0.0%), Croatian (62.2%, a difference of 0.0%), Chinese (62.2%, a difference of 0.010%), British (62.3%, a difference of 0.12%), and Icelander (62.1%, a difference of 0.17%).
| Demographics | Rating | Rank | College, 1 year or more |
| Immigrants | Eastern Europe | 97.8 /100 | #91 | Exceptional 62.4% |
| Immigrants | Egypt | 97.8 /100 | #92 | Exceptional 62.4% |
| Romanians | 97.7 /100 | #93 | Exceptional 62.4% |
| Immigrants | Croatia | 97.6 /100 | #94 | Exceptional 62.3% |
| British | 97.4 /100 | #95 | Exceptional 62.3% |
| Chinese | 97.2 /100 | #96 | Exceptional 62.2% |
| Jordanians | 97.2 /100 | #97 | Exceptional 62.2% |
| Carpatho Rusyns | 97.2 /100 | #98 | Exceptional 62.2% |
| Croatians | 97.1 /100 | #99 | Exceptional 62.2% |
| Icelanders | 96.8 /100 | #100 | Exceptional 62.1% |
| Swedes | 96.8 /100 | #101 | Exceptional 62.1% |
| Luxembourgers | 96.7 /100 | #102 | Exceptional 62.1% |
| Afghans | 96.4 /100 | #103 | Exceptional 62.0% |
| Chileans | 96.4 /100 | #104 | Exceptional 62.0% |
| Immigrants | Nepal | 96.3 /100 | #105 | Exceptional 62.0% |