Austrian vs Hopi Bachelor's Degree
COMPARE
Austrian
Hopi
Bachelor's Degree
Bachelor's Degree Comparison
Austrians
Hopi
40.6%
BACHELOR'S DEGREE
95.5/ 100
METRIC RATING
117th/ 347
METRIC RANK
25.3%
BACHELOR'S DEGREE
0.0/ 100
METRIC RATING
339th/ 347
METRIC RANK
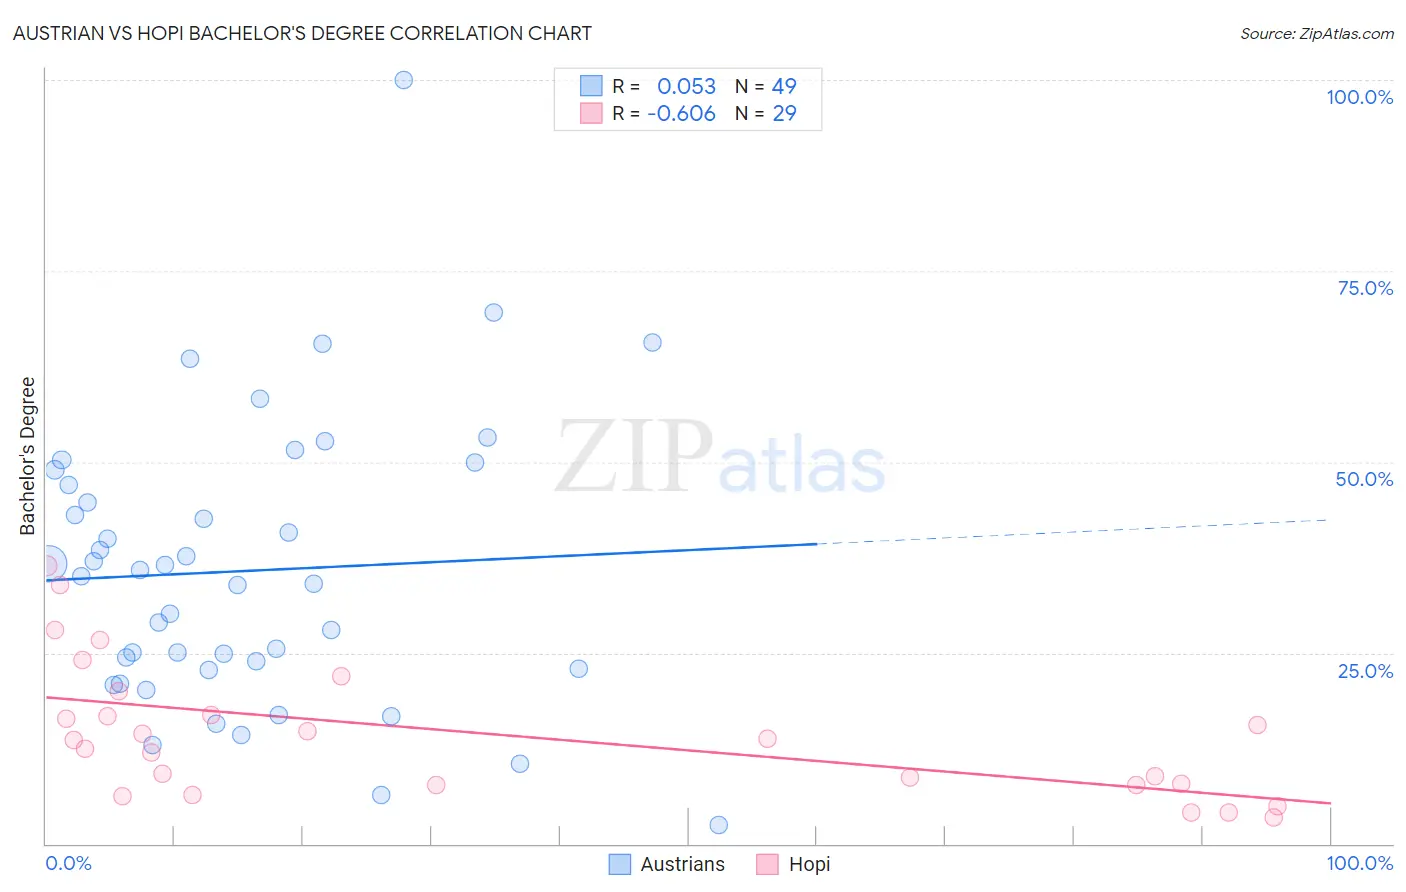
Austrian vs Hopi Bachelor's Degree Correlation Chart
The statistical analysis conducted on geographies consisting of 452,047,267 people shows a slight positive correlation between the proportion of Austrians and percentage of population with at least bachelor's degree education in the United States with a correlation coefficient (R) of 0.053 and weighted average of 40.6%. Similarly, the statistical analysis conducted on geographies consisting of 74,738,179 people shows a significant negative correlation between the proportion of Hopi and percentage of population with at least bachelor's degree education in the United States with a correlation coefficient (R) of -0.606 and weighted average of 25.3%, a difference of 60.6%.
Bachelor's Degree Correlation Summary
| Measurement | Austrian | Hopi |
| Minimum | 2.4% | 3.5% |
| Maximum | 100.0% | 36.4% |
| Range | 97.6% | 32.9% |
| Mean | 35.7% | 14.4% |
| Median | 35.1% | 13.6% |
| Interquartile 25% (IQ1) | 22.9% | 7.7% |
| Interquartile 75% (IQ3) | 48.0% | 18.4% |
| Interquartile Range (IQR) | 25.1% | 10.7% |
| Standard Deviation (Sample) | 18.7% | 8.8% |
| Standard Deviation (Population) | 18.5% | 8.7% |
Similar Demographics by Bachelor's Degree
Demographics Similar to Austrians by Bachelor's Degree
In terms of bachelor's degree, the demographic groups most similar to Austrians are Croatian (40.6%, a difference of 0.020%), Immigrants from Uganda (40.7%, a difference of 0.10%), Palestinian (40.7%, a difference of 0.15%), Immigrants from Syria (40.5%, a difference of 0.34%), and Afghan (40.8%, a difference of 0.39%).
| Demographics | Rating | Rank | Bachelor's Degree |
| Albanians | 96.5 /100 | #110 | Exceptional 40.9% |
| Immigrants | Chile | 96.4 /100 | #111 | Exceptional 40.8% |
| Ugandans | 96.3 /100 | #112 | Exceptional 40.8% |
| Brazilians | 96.3 /100 | #113 | Exceptional 40.8% |
| Afghans | 96.2 /100 | #114 | Exceptional 40.8% |
| Palestinians | 95.8 /100 | #115 | Exceptional 40.7% |
| Immigrants | Uganda | 95.7 /100 | #116 | Exceptional 40.7% |
| Austrians | 95.5 /100 | #117 | Exceptional 40.6% |
| Croatians | 95.5 /100 | #118 | Exceptional 40.6% |
| Immigrants | Syria | 94.9 /100 | #119 | Exceptional 40.5% |
| Venezuelans | 94.7 /100 | #120 | Exceptional 40.5% |
| Moroccans | 94.6 /100 | #121 | Exceptional 40.5% |
| Immigrants | Albania | 94.4 /100 | #122 | Exceptional 40.4% |
| Lebanese | 94.3 /100 | #123 | Exceptional 40.4% |
| Immigrants | Eritrea | 94.3 /100 | #124 | Exceptional 40.4% |
Demographics Similar to Hopi by Bachelor's Degree
In terms of bachelor's degree, the demographic groups most similar to Hopi are Pueblo (25.5%, a difference of 0.93%), Inupiat (25.8%, a difference of 2.0%), Lumbee (24.8%, a difference of 2.2%), Yuman (24.5%, a difference of 3.1%), and Immigrants from Mexico (26.1%, a difference of 3.3%).
| Demographics | Rating | Rank | Bachelor's Degree |
| Menominee | 0.0 /100 | #332 | Tragic 27.3% |
| Mexicans | 0.0 /100 | #333 | Tragic 27.1% |
| Arapaho | 0.0 /100 | #334 | Tragic 26.6% |
| Natives/Alaskans | 0.0 /100 | #335 | Tragic 26.3% |
| Immigrants | Mexico | 0.0 /100 | #336 | Tragic 26.1% |
| Inupiat | 0.0 /100 | #337 | Tragic 25.8% |
| Pueblo | 0.0 /100 | #338 | Tragic 25.5% |
| Hopi | 0.0 /100 | #339 | Tragic 25.3% |
| Lumbee | 0.0 /100 | #340 | Tragic 24.8% |
| Yuman | 0.0 /100 | #341 | Tragic 24.5% |
| Yakama | 0.0 /100 | #342 | Tragic 24.5% |
| Tohono O'odham | 0.0 /100 | #343 | Tragic 24.4% |
| Navajo | 0.0 /100 | #344 | Tragic 23.6% |
| Pima | 0.0 /100 | #345 | Tragic 23.2% |
| Houma | 0.0 /100 | #346 | Tragic 21.4% |