Austrian vs West Indian Bachelor's Degree
COMPARE
Austrian
West Indian
Bachelor's Degree
Bachelor's Degree Comparison
Austrians
West Indians
40.6%
BACHELOR'S DEGREE
95.5/ 100
METRIC RATING
117th/ 347
METRIC RANK
35.8%
BACHELOR'S DEGREE
9.7/ 100
METRIC RATING
219th/ 347
METRIC RANK
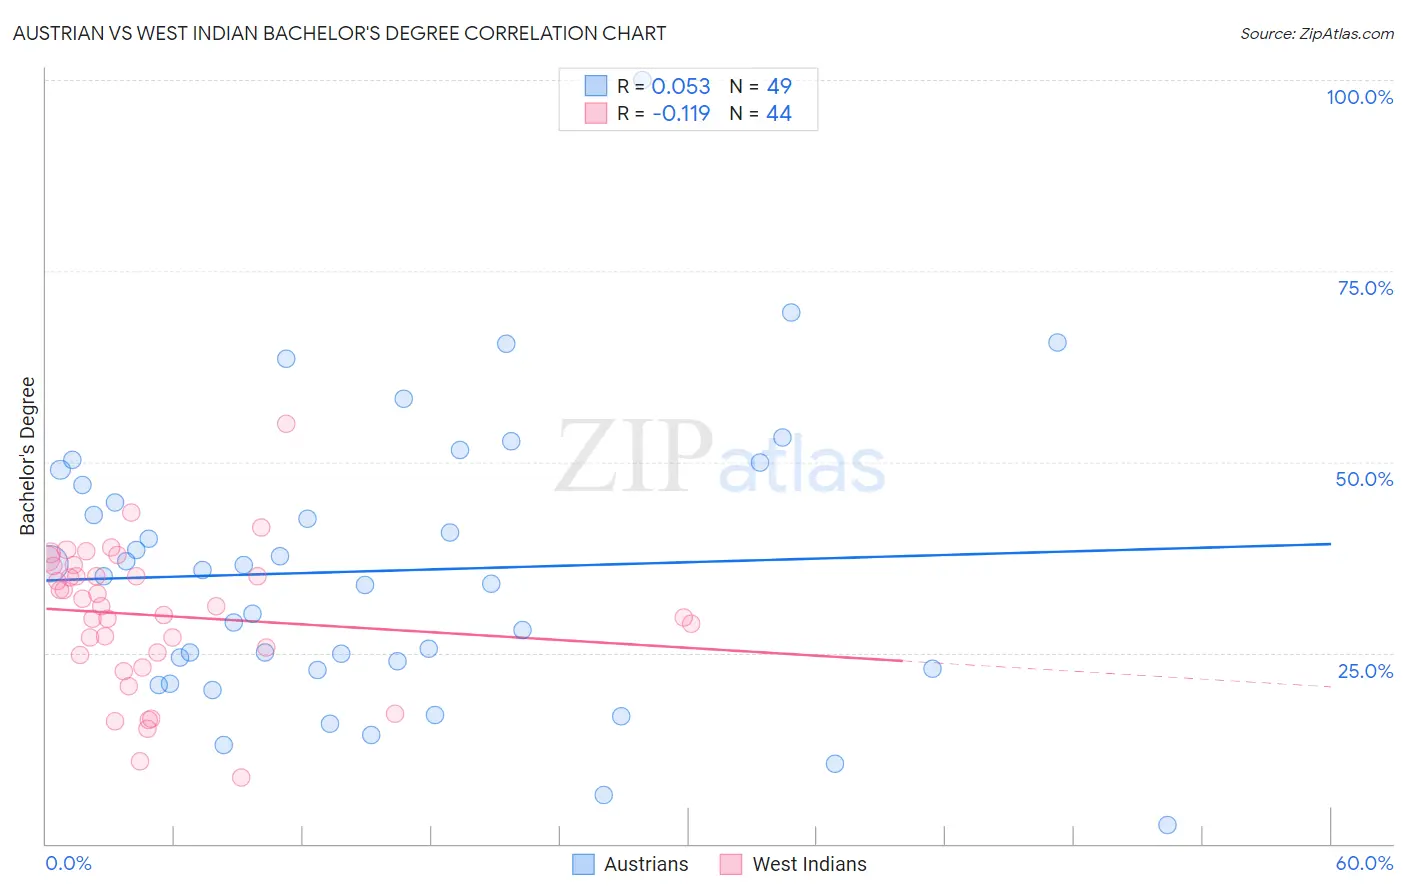
Austrian vs West Indian Bachelor's Degree Correlation Chart
The statistical analysis conducted on geographies consisting of 452,047,267 people shows a slight positive correlation between the proportion of Austrians and percentage of population with at least bachelor's degree education in the United States with a correlation coefficient (R) of 0.053 and weighted average of 40.6%. Similarly, the statistical analysis conducted on geographies consisting of 254,052,702 people shows a poor negative correlation between the proportion of West Indians and percentage of population with at least bachelor's degree education in the United States with a correlation coefficient (R) of -0.119 and weighted average of 35.8%, a difference of 13.6%.
Bachelor's Degree Correlation Summary
| Measurement | Austrian | West Indian |
| Minimum | 2.4% | 8.6% |
| Maximum | 100.0% | 54.9% |
| Range | 97.6% | 46.3% |
| Mean | 35.7% | 29.9% |
| Median | 35.1% | 31.1% |
| Interquartile 25% (IQ1) | 22.9% | 24.9% |
| Interquartile 75% (IQ3) | 48.0% | 35.7% |
| Interquartile Range (IQR) | 25.1% | 10.9% |
| Standard Deviation (Sample) | 18.7% | 9.2% |
| Standard Deviation (Population) | 18.5% | 9.1% |
Similar Demographics by Bachelor's Degree
Demographics Similar to Austrians by Bachelor's Degree
In terms of bachelor's degree, the demographic groups most similar to Austrians are Croatian (40.6%, a difference of 0.020%), Immigrants from Uganda (40.7%, a difference of 0.10%), Palestinian (40.7%, a difference of 0.15%), Immigrants from Syria (40.5%, a difference of 0.34%), and Afghan (40.8%, a difference of 0.39%).
| Demographics | Rating | Rank | Bachelor's Degree |
| Albanians | 96.5 /100 | #110 | Exceptional 40.9% |
| Immigrants | Chile | 96.4 /100 | #111 | Exceptional 40.8% |
| Ugandans | 96.3 /100 | #112 | Exceptional 40.8% |
| Brazilians | 96.3 /100 | #113 | Exceptional 40.8% |
| Afghans | 96.2 /100 | #114 | Exceptional 40.8% |
| Palestinians | 95.8 /100 | #115 | Exceptional 40.7% |
| Immigrants | Uganda | 95.7 /100 | #116 | Exceptional 40.7% |
| Austrians | 95.5 /100 | #117 | Exceptional 40.6% |
| Croatians | 95.5 /100 | #118 | Exceptional 40.6% |
| Immigrants | Syria | 94.9 /100 | #119 | Exceptional 40.5% |
| Venezuelans | 94.7 /100 | #120 | Exceptional 40.5% |
| Moroccans | 94.6 /100 | #121 | Exceptional 40.5% |
| Immigrants | Albania | 94.4 /100 | #122 | Exceptional 40.4% |
| Lebanese | 94.3 /100 | #123 | Exceptional 40.4% |
| Immigrants | Eritrea | 94.3 /100 | #124 | Exceptional 40.4% |
Demographics Similar to West Indians by Bachelor's Degree
In terms of bachelor's degree, the demographic groups most similar to West Indians are Subsaharan African (35.8%, a difference of 0.030%), Spanish (35.8%, a difference of 0.040%), German Russian (35.8%, a difference of 0.13%), Dutch (35.7%, a difference of 0.15%), and Trinidadian and Tobagonian (35.7%, a difference of 0.29%).
| Demographics | Rating | Rank | Bachelor's Degree |
| Immigrants | Philippines | 17.8 /100 | #212 | Poor 36.4% |
| Immigrants | Panama | 14.2 /100 | #213 | Poor 36.2% |
| Germans | 13.9 /100 | #214 | Poor 36.1% |
| Immigrants | Western Africa | 13.8 /100 | #215 | Poor 36.1% |
| Barbadians | 13.5 /100 | #216 | Poor 36.1% |
| German Russians | 10.2 /100 | #217 | Poor 35.8% |
| Sub-Saharan Africans | 9.8 /100 | #218 | Tragic 35.8% |
| West Indians | 9.7 /100 | #219 | Tragic 35.8% |
| Spanish | 9.6 /100 | #220 | Tragic 35.8% |
| Dutch | 9.2 /100 | #221 | Tragic 35.7% |
| Trinidadians and Tobagonians | 8.8 /100 | #222 | Tragic 35.7% |
| French Canadians | 8.3 /100 | #223 | Tragic 35.6% |
| Immigrants | Barbados | 7.5 /100 | #224 | Tragic 35.5% |
| Immigrants | Burma/Myanmar | 7.3 /100 | #225 | Tragic 35.5% |
| Portuguese | 7.2 /100 | #226 | Tragic 35.5% |