European vs Hopi Bachelor's Degree
COMPARE
European
Hopi
Bachelor's Degree
Bachelor's Degree Comparison
Europeans
Hopi
39.5%
BACHELOR'S DEGREE
85.6/ 100
METRIC RATING
138th/ 347
METRIC RANK
25.3%
BACHELOR'S DEGREE
0.0/ 100
METRIC RATING
339th/ 347
METRIC RANK
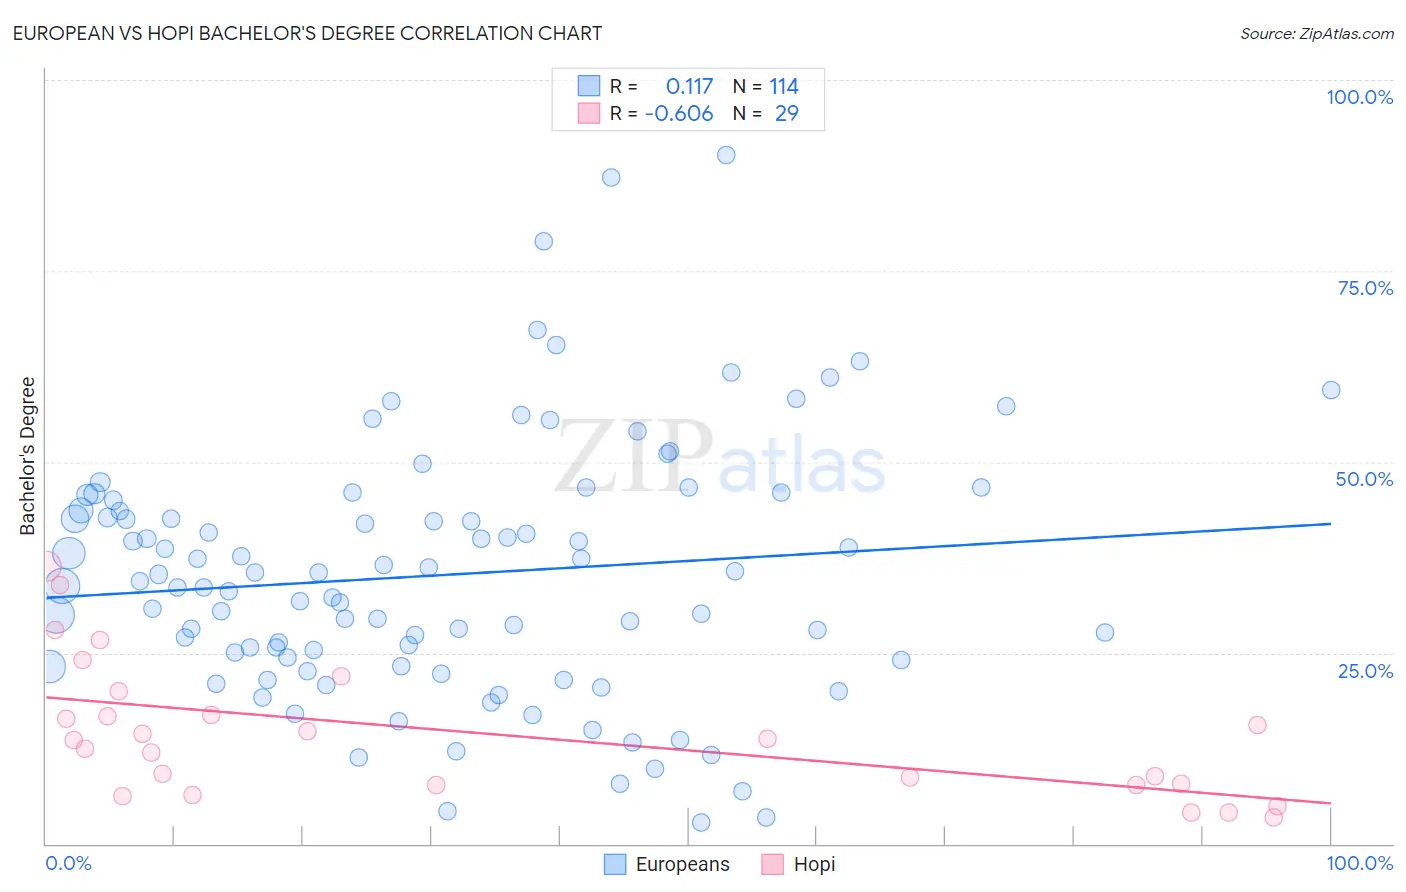
European vs Hopi Bachelor's Degree Correlation Chart
The statistical analysis conducted on geographies consisting of 561,699,740 people shows a poor positive correlation between the proportion of Europeans and percentage of population with at least bachelor's degree education in the United States with a correlation coefficient (R) of 0.117 and weighted average of 39.5%. Similarly, the statistical analysis conducted on geographies consisting of 74,738,179 people shows a significant negative correlation between the proportion of Hopi and percentage of population with at least bachelor's degree education in the United States with a correlation coefficient (R) of -0.606 and weighted average of 25.3%, a difference of 56.0%.
Bachelor's Degree Correlation Summary
| Measurement | European | Hopi |
| Minimum | 2.8% | 3.5% |
| Maximum | 90.2% | 36.4% |
| Range | 87.4% | 32.9% |
| Mean | 35.2% | 14.4% |
| Median | 34.1% | 13.6% |
| Interquartile 25% (IQ1) | 24.1% | 7.7% |
| Interquartile 75% (IQ3) | 43.7% | 18.4% |
| Interquartile Range (IQR) | 19.5% | 10.7% |
| Standard Deviation (Sample) | 16.6% | 8.8% |
| Standard Deviation (Population) | 16.6% | 8.7% |
Similar Demographics by Bachelor's Degree
Demographics Similar to Europeans by Bachelor's Degree
In terms of bachelor's degree, the demographic groups most similar to Europeans are Icelander (39.5%, a difference of 0.17%), Immigrants from Sudan (39.4%, a difference of 0.20%), Immigrants from Armenia (39.4%, a difference of 0.27%), South American Indian (39.3%, a difference of 0.35%), and Pakistani (39.7%, a difference of 0.54%).
| Demographics | Rating | Rank | Bachelor's Degree |
| Italians | 91.9 /100 | #131 | Exceptional 40.1% |
| Taiwanese | 91.1 /100 | #132 | Exceptional 40.0% |
| Immigrants | Southern Europe | 91.1 /100 | #133 | Exceptional 40.0% |
| Assyrians/Chaldeans/Syriacs | 89.4 /100 | #134 | Excellent 39.8% |
| Luxembourgers | 89.1 /100 | #135 | Excellent 39.8% |
| Pakistanis | 88.2 /100 | #136 | Excellent 39.7% |
| Icelanders | 86.5 /100 | #137 | Excellent 39.5% |
| Europeans | 85.6 /100 | #138 | Excellent 39.5% |
| Immigrants | Sudan | 84.5 /100 | #139 | Excellent 39.4% |
| Immigrants | Armenia | 84.1 /100 | #140 | Excellent 39.4% |
| South American Indians | 83.6 /100 | #141 | Excellent 39.3% |
| Immigrants | North Macedonia | 81.6 /100 | #142 | Excellent 39.2% |
| Poles | 79.8 /100 | #143 | Good 39.1% |
| Immigrants | Afghanistan | 79.7 /100 | #144 | Good 39.1% |
| Slovenes | 79.5 /100 | #145 | Good 39.1% |
Demographics Similar to Hopi by Bachelor's Degree
In terms of bachelor's degree, the demographic groups most similar to Hopi are Pueblo (25.5%, a difference of 0.93%), Inupiat (25.8%, a difference of 2.0%), Lumbee (24.8%, a difference of 2.2%), Yuman (24.5%, a difference of 3.1%), and Immigrants from Mexico (26.1%, a difference of 3.3%).
| Demographics | Rating | Rank | Bachelor's Degree |
| Menominee | 0.0 /100 | #332 | Tragic 27.3% |
| Mexicans | 0.0 /100 | #333 | Tragic 27.1% |
| Arapaho | 0.0 /100 | #334 | Tragic 26.6% |
| Natives/Alaskans | 0.0 /100 | #335 | Tragic 26.3% |
| Immigrants | Mexico | 0.0 /100 | #336 | Tragic 26.1% |
| Inupiat | 0.0 /100 | #337 | Tragic 25.8% |
| Pueblo | 0.0 /100 | #338 | Tragic 25.5% |
| Hopi | 0.0 /100 | #339 | Tragic 25.3% |
| Lumbee | 0.0 /100 | #340 | Tragic 24.8% |
| Yuman | 0.0 /100 | #341 | Tragic 24.5% |
| Yakama | 0.0 /100 | #342 | Tragic 24.5% |
| Tohono O'odham | 0.0 /100 | #343 | Tragic 24.4% |
| Navajo | 0.0 /100 | #344 | Tragic 23.6% |
| Pima | 0.0 /100 | #345 | Tragic 23.2% |
| Houma | 0.0 /100 | #346 | Tragic 21.4% |