Austrian vs Immigrants from Iraq Bachelor's Degree
COMPARE
Austrian
Immigrants from Iraq
Bachelor's Degree
Bachelor's Degree Comparison
Austrians
Immigrants from Iraq
40.6%
BACHELOR'S DEGREE
95.5/ 100
METRIC RATING
117th/ 347
METRIC RANK
37.9%
BACHELOR'S DEGREE
52.5/ 100
METRIC RATING
173rd/ 347
METRIC RANK
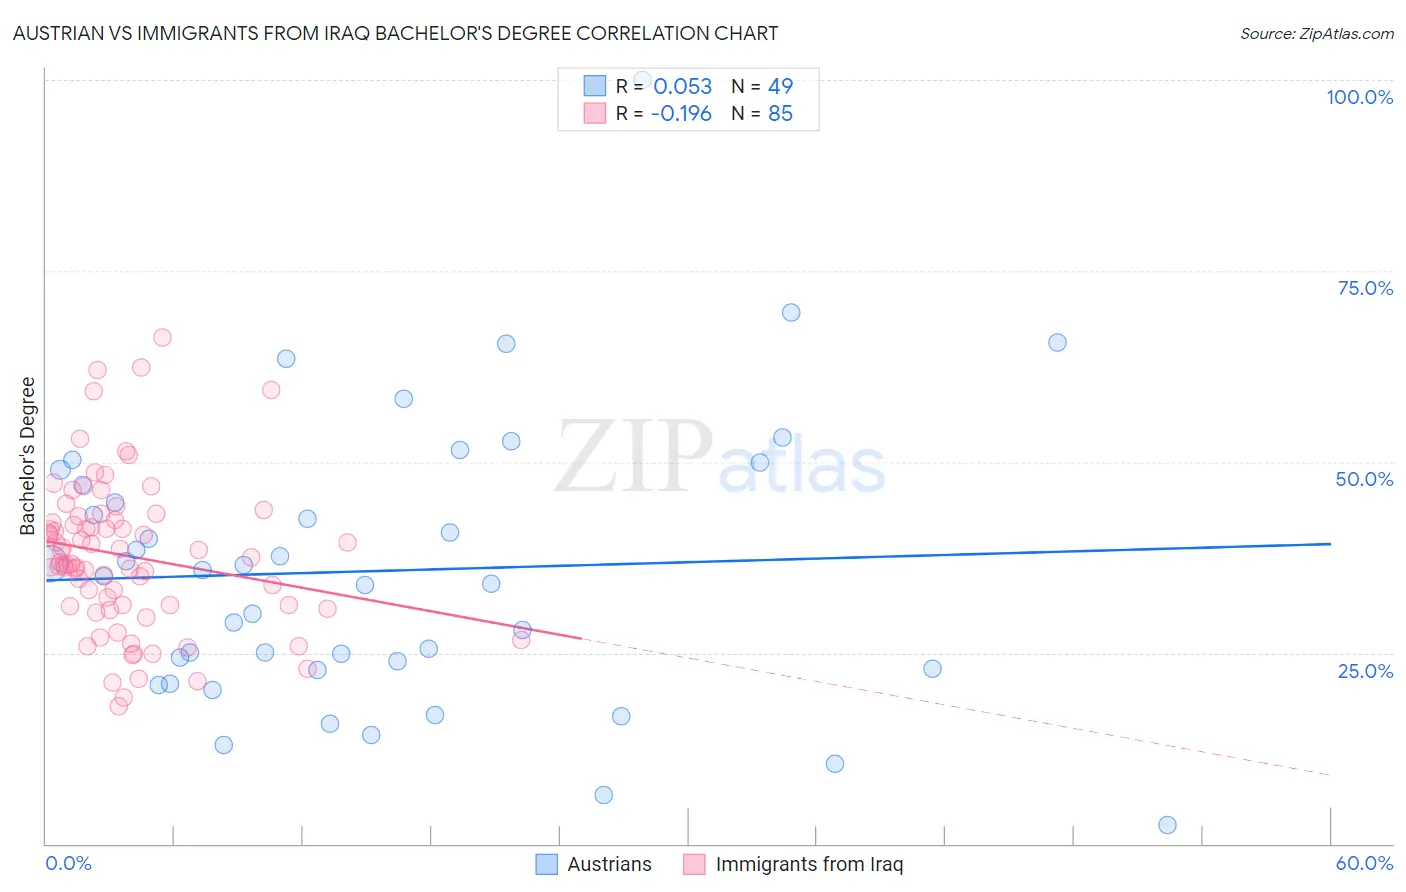
Austrian vs Immigrants from Iraq Bachelor's Degree Correlation Chart
The statistical analysis conducted on geographies consisting of 452,047,267 people shows a slight positive correlation between the proportion of Austrians and percentage of population with at least bachelor's degree education in the United States with a correlation coefficient (R) of 0.053 and weighted average of 40.6%. Similarly, the statistical analysis conducted on geographies consisting of 194,775,437 people shows a poor negative correlation between the proportion of Immigrants from Iraq and percentage of population with at least bachelor's degree education in the United States with a correlation coefficient (R) of -0.196 and weighted average of 37.9%, a difference of 7.2%.
Bachelor's Degree Correlation Summary
| Measurement | Austrian | Immigrants from Iraq |
| Minimum | 2.4% | 18.0% |
| Maximum | 100.0% | 66.3% |
| Range | 97.6% | 48.3% |
| Mean | 35.7% | 37.7% |
| Median | 35.1% | 36.8% |
| Interquartile 25% (IQ1) | 22.9% | 31.2% |
| Interquartile 75% (IQ3) | 48.0% | 42.7% |
| Interquartile Range (IQR) | 25.1% | 11.5% |
| Standard Deviation (Sample) | 18.7% | 9.9% |
| Standard Deviation (Population) | 18.5% | 9.8% |
Similar Demographics by Bachelor's Degree
Demographics Similar to Austrians by Bachelor's Degree
In terms of bachelor's degree, the demographic groups most similar to Austrians are Croatian (40.6%, a difference of 0.020%), Immigrants from Uganda (40.7%, a difference of 0.10%), Palestinian (40.7%, a difference of 0.15%), Immigrants from Syria (40.5%, a difference of 0.34%), and Afghan (40.8%, a difference of 0.39%).
| Demographics | Rating | Rank | Bachelor's Degree |
| Albanians | 96.5 /100 | #110 | Exceptional 40.9% |
| Immigrants | Chile | 96.4 /100 | #111 | Exceptional 40.8% |
| Ugandans | 96.3 /100 | #112 | Exceptional 40.8% |
| Brazilians | 96.3 /100 | #113 | Exceptional 40.8% |
| Afghans | 96.2 /100 | #114 | Exceptional 40.8% |
| Palestinians | 95.8 /100 | #115 | Exceptional 40.7% |
| Immigrants | Uganda | 95.7 /100 | #116 | Exceptional 40.7% |
| Austrians | 95.5 /100 | #117 | Exceptional 40.6% |
| Croatians | 95.5 /100 | #118 | Exceptional 40.6% |
| Immigrants | Syria | 94.9 /100 | #119 | Exceptional 40.5% |
| Venezuelans | 94.7 /100 | #120 | Exceptional 40.5% |
| Moroccans | 94.6 /100 | #121 | Exceptional 40.5% |
| Immigrants | Albania | 94.4 /100 | #122 | Exceptional 40.4% |
| Lebanese | 94.3 /100 | #123 | Exceptional 40.4% |
| Immigrants | Eritrea | 94.3 /100 | #124 | Exceptional 40.4% |
Demographics Similar to Immigrants from Iraq by Bachelor's Degree
In terms of bachelor's degree, the demographic groups most similar to Immigrants from Iraq are Immigrants from Somalia (37.9%, a difference of 0.020%), Bermudan (38.0%, a difference of 0.16%), Czech (38.0%, a difference of 0.18%), Immigrants from Bangladesh (37.8%, a difference of 0.25%), and Ghanaian (38.0%, a difference of 0.27%).
| Demographics | Rating | Rank | Bachelor's Degree |
| Somalis | 58.6 /100 | #166 | Average 38.1% |
| Scottish | 56.6 /100 | #167 | Average 38.1% |
| Danes | 56.2 /100 | #168 | Average 38.1% |
| Ghanaians | 55.3 /100 | #169 | Average 38.0% |
| Czechs | 54.4 /100 | #170 | Average 38.0% |
| Bermudans | 54.2 /100 | #171 | Average 38.0% |
| Immigrants | Somalia | 52.8 /100 | #172 | Average 37.9% |
| Immigrants | Iraq | 52.5 /100 | #173 | Average 37.9% |
| Immigrants | Bangladesh | 50.0 /100 | #174 | Average 37.8% |
| Immigrants | Uruguay | 48.3 /100 | #175 | Average 37.8% |
| Costa Ricans | 47.6 /100 | #176 | Average 37.7% |
| Basques | 47.4 /100 | #177 | Average 37.7% |
| Immigrants | Cameroon | 46.8 /100 | #178 | Average 37.7% |
| Immigrants | Colombia | 45.4 /100 | #179 | Average 37.7% |
| Irish | 44.3 /100 | #180 | Average 37.6% |