Austrian vs French American Indian Bachelor's Degree
COMPARE
Austrian
French American Indian
Bachelor's Degree
Bachelor's Degree Comparison
Austrians
French American Indians
40.6%
BACHELOR'S DEGREE
95.5/ 100
METRIC RATING
117th/ 347
METRIC RANK
33.1%
BACHELOR'S DEGREE
0.6/ 100
METRIC RATING
258th/ 347
METRIC RANK
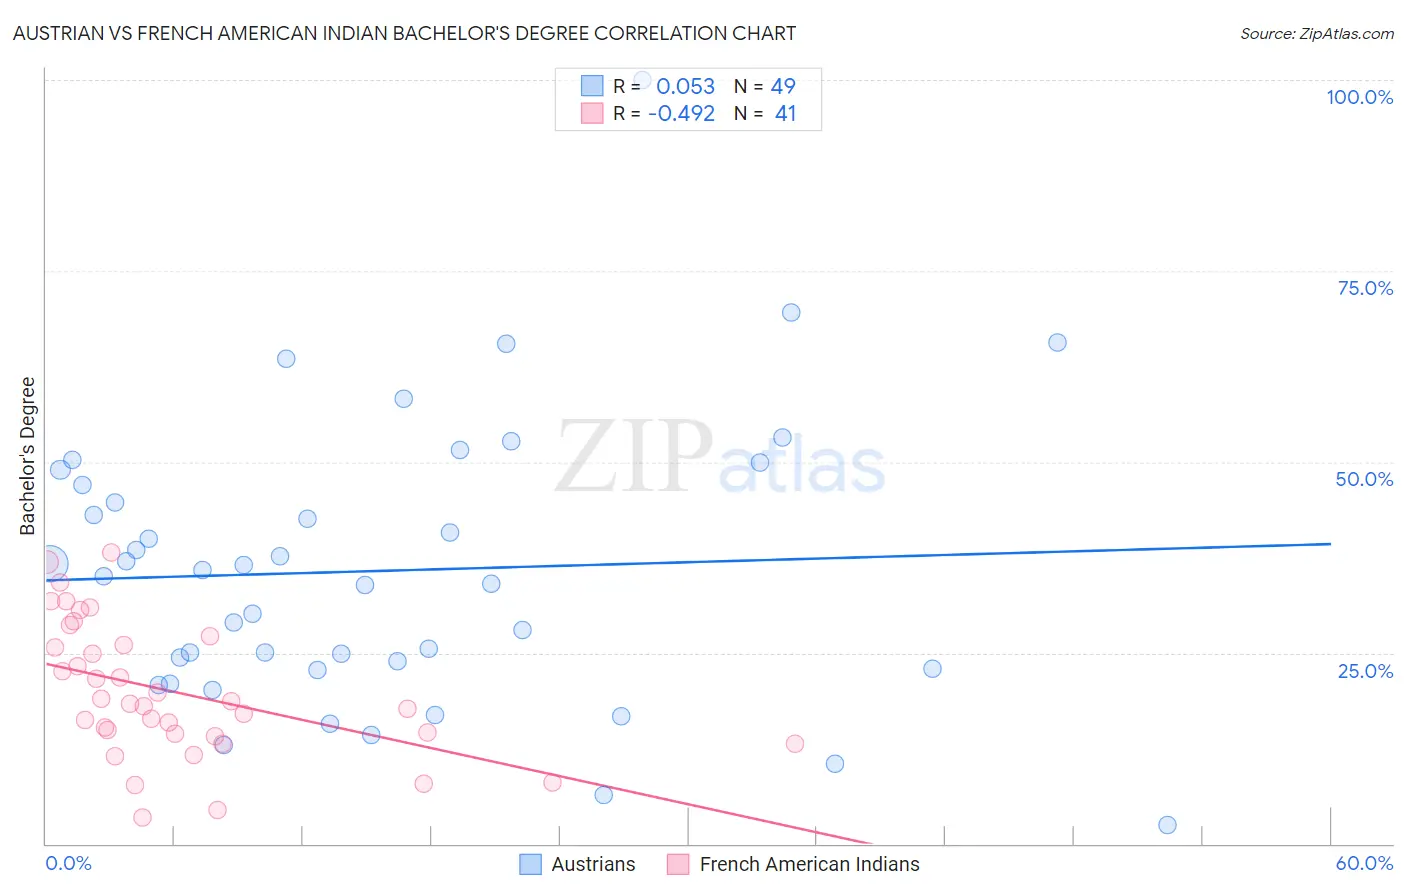
Austrian vs French American Indian Bachelor's Degree Correlation Chart
The statistical analysis conducted on geographies consisting of 452,047,267 people shows a slight positive correlation between the proportion of Austrians and percentage of population with at least bachelor's degree education in the United States with a correlation coefficient (R) of 0.053 and weighted average of 40.6%. Similarly, the statistical analysis conducted on geographies consisting of 131,974,531 people shows a moderate negative correlation between the proportion of French American Indians and percentage of population with at least bachelor's degree education in the United States with a correlation coefficient (R) of -0.492 and weighted average of 33.1%, a difference of 22.9%.
Bachelor's Degree Correlation Summary
| Measurement | Austrian | French American Indian |
| Minimum | 2.4% | 3.4% |
| Maximum | 100.0% | 38.2% |
| Range | 97.6% | 34.8% |
| Mean | 35.7% | 19.9% |
| Median | 35.1% | 18.3% |
| Interquartile 25% (IQ1) | 22.9% | 14.3% |
| Interquartile 75% (IQ3) | 48.0% | 26.5% |
| Interquartile Range (IQR) | 25.1% | 12.3% |
| Standard Deviation (Sample) | 18.7% | 8.8% |
| Standard Deviation (Population) | 18.5% | 8.6% |
Similar Demographics by Bachelor's Degree
Demographics Similar to Austrians by Bachelor's Degree
In terms of bachelor's degree, the demographic groups most similar to Austrians are Croatian (40.6%, a difference of 0.020%), Immigrants from Uganda (40.7%, a difference of 0.10%), Palestinian (40.7%, a difference of 0.15%), Immigrants from Syria (40.5%, a difference of 0.34%), and Afghan (40.8%, a difference of 0.39%).
| Demographics | Rating | Rank | Bachelor's Degree |
| Albanians | 96.5 /100 | #110 | Exceptional 40.9% |
| Immigrants | Chile | 96.4 /100 | #111 | Exceptional 40.8% |
| Ugandans | 96.3 /100 | #112 | Exceptional 40.8% |
| Brazilians | 96.3 /100 | #113 | Exceptional 40.8% |
| Afghans | 96.2 /100 | #114 | Exceptional 40.8% |
| Palestinians | 95.8 /100 | #115 | Exceptional 40.7% |
| Immigrants | Uganda | 95.7 /100 | #116 | Exceptional 40.7% |
| Austrians | 95.5 /100 | #117 | Exceptional 40.6% |
| Croatians | 95.5 /100 | #118 | Exceptional 40.6% |
| Immigrants | Syria | 94.9 /100 | #119 | Exceptional 40.5% |
| Venezuelans | 94.7 /100 | #120 | Exceptional 40.5% |
| Moroccans | 94.6 /100 | #121 | Exceptional 40.5% |
| Immigrants | Albania | 94.4 /100 | #122 | Exceptional 40.4% |
| Lebanese | 94.3 /100 | #123 | Exceptional 40.4% |
| Immigrants | Eritrea | 94.3 /100 | #124 | Exceptional 40.4% |
Demographics Similar to French American Indians by Bachelor's Degree
In terms of bachelor's degree, the demographic groups most similar to French American Indians are Spanish American (33.1%, a difference of 0.040%), Osage (33.0%, a difference of 0.050%), Nicaraguan (33.1%, a difference of 0.26%), Malaysian (32.9%, a difference of 0.41%), and Iroquois (33.2%, a difference of 0.45%).
| Demographics | Rating | Rank | Bachelor's Degree |
| Japanese | 0.7 /100 | #251 | Tragic 33.3% |
| Immigrants | Bahamas | 0.7 /100 | #252 | Tragic 33.3% |
| U.S. Virgin Islanders | 0.7 /100 | #253 | Tragic 33.2% |
| Native Hawaiians | 0.7 /100 | #254 | Tragic 33.2% |
| Iroquois | 0.7 /100 | #255 | Tragic 33.2% |
| Nicaraguans | 0.6 /100 | #256 | Tragic 33.1% |
| Spanish Americans | 0.6 /100 | #257 | Tragic 33.1% |
| French American Indians | 0.6 /100 | #258 | Tragic 33.1% |
| Osage | 0.5 /100 | #259 | Tragic 33.0% |
| Malaysians | 0.5 /100 | #260 | Tragic 32.9% |
| Africans | 0.5 /100 | #261 | Tragic 32.9% |
| Immigrants | Jamaica | 0.5 /100 | #262 | Tragic 32.9% |
| Belizeans | 0.4 /100 | #263 | Tragic 32.8% |
| Central American Indians | 0.3 /100 | #264 | Tragic 32.5% |
| Bahamians | 0.3 /100 | #265 | Tragic 32.5% |