Austrian vs Hopi 4th Grade
COMPARE
Austrian
Hopi
4th Grade
4th Grade Comparison
Austrians
Hopi
98.1%
4TH GRADE
99.8/ 100
METRIC RATING
57th/ 347
METRIC RANK
97.7%
4TH GRADE
80.6/ 100
METRIC RATING
148th/ 347
METRIC RANK
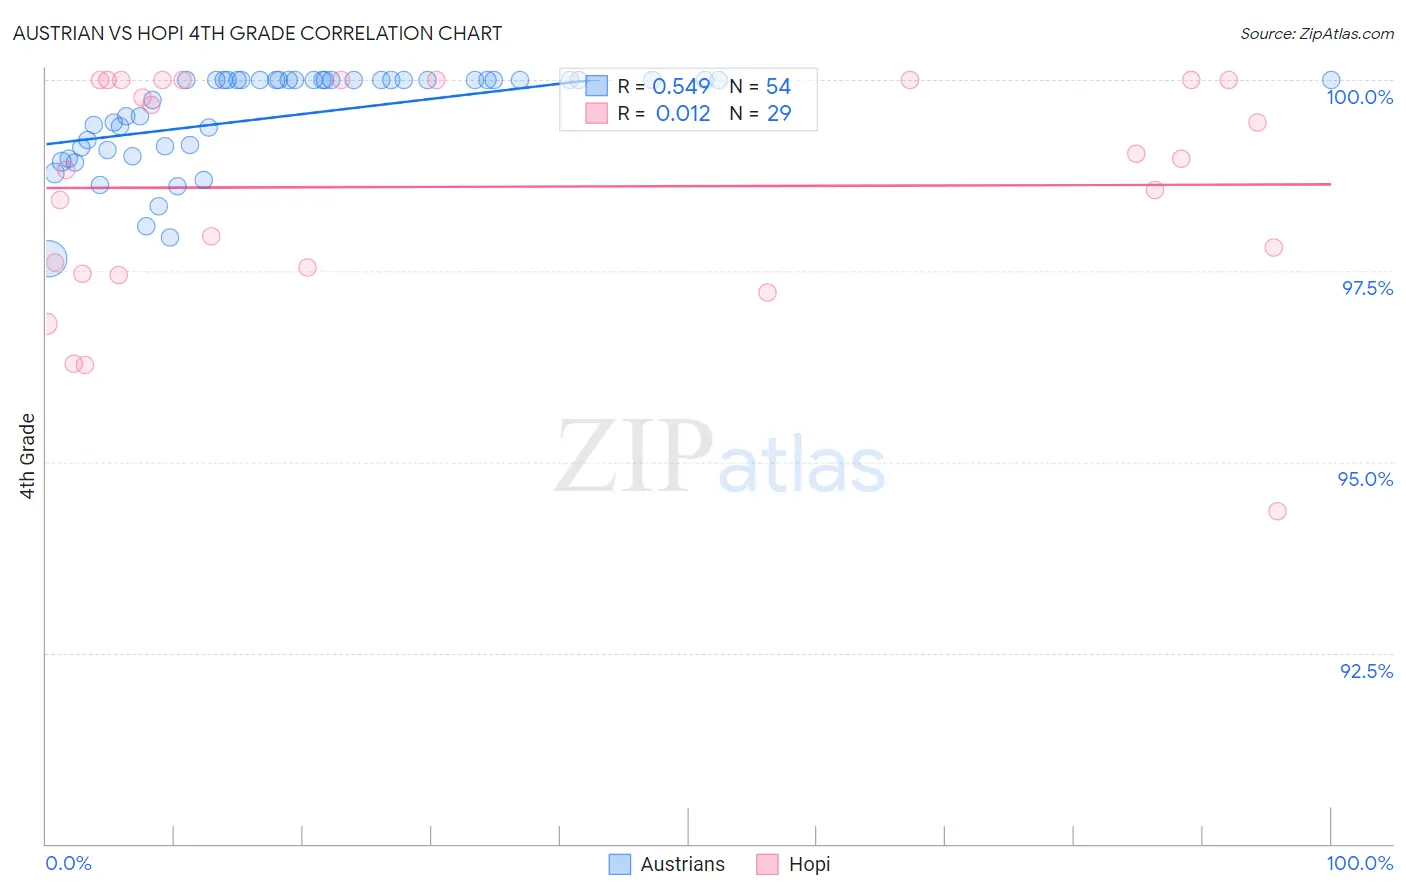
Austrian vs Hopi 4th Grade Correlation Chart
The statistical analysis conducted on geographies consisting of 452,080,536 people shows a substantial positive correlation between the proportion of Austrians and percentage of population with at least 4th grade education in the United States with a correlation coefficient (R) of 0.549 and weighted average of 98.1%. Similarly, the statistical analysis conducted on geographies consisting of 74,739,957 people shows no correlation between the proportion of Hopi and percentage of population with at least 4th grade education in the United States with a correlation coefficient (R) of 0.012 and weighted average of 97.7%, a difference of 0.44%.
4th Grade Correlation Summary
| Measurement | Austrian | Hopi |
| Minimum | 97.7% | 94.4% |
| Maximum | 100.0% | 100.0% |
| Range | 2.3% | 5.6% |
| Mean | 99.5% | 98.6% |
| Median | 100.0% | 99.0% |
| Interquartile 25% (IQ1) | 99.1% | 97.5% |
| Interquartile 75% (IQ3) | 100.0% | 100.0% |
| Interquartile Range (IQR) | 0.89% | 2.5% |
| Standard Deviation (Sample) | 0.63% | 1.5% |
| Standard Deviation (Population) | 0.63% | 1.5% |
Similar Demographics by 4th Grade
Demographics Similar to Austrians by 4th Grade
In terms of 4th grade, the demographic groups most similar to Austrians are Maltese (98.1%, a difference of 0.0%), White/Caucasian (98.1%, a difference of 0.0%), Greek (98.1%, a difference of 0.0%), Creek (98.1%, a difference of 0.0%), and Celtic (98.1%, a difference of 0.010%).
| Demographics | Rating | Rank | 4th Grade |
| Immigrants | Scotland | 99.8 /100 | #50 | Exceptional 98.1% |
| Celtics | 99.8 /100 | #51 | Exceptional 98.1% |
| Australians | 99.8 /100 | #52 | Exceptional 98.1% |
| Slavs | 99.8 /100 | #53 | Exceptional 98.1% |
| Maltese | 99.8 /100 | #54 | Exceptional 98.1% |
| Whites/Caucasians | 99.8 /100 | #55 | Exceptional 98.1% |
| Greeks | 99.8 /100 | #56 | Exceptional 98.1% |
| Austrians | 99.8 /100 | #57 | Exceptional 98.1% |
| Creek | 99.8 /100 | #58 | Exceptional 98.1% |
| Americans | 99.8 /100 | #59 | Exceptional 98.1% |
| Immigrants | Canada | 99.7 /100 | #60 | Exceptional 98.1% |
| Immigrants | North America | 99.7 /100 | #61 | Exceptional 98.1% |
| Serbians | 99.7 /100 | #62 | Exceptional 98.1% |
| Russians | 99.7 /100 | #63 | Exceptional 98.0% |
| Cajuns | 99.7 /100 | #64 | Exceptional 98.0% |
Demographics Similar to Hopi by 4th Grade
In terms of 4th grade, the demographic groups most similar to Hopi are Jordanian (97.7%, a difference of 0.0%), Ute (97.7%, a difference of 0.0%), Burmese (97.7%, a difference of 0.010%), Spaniard (97.7%, a difference of 0.010%), and Immigrants from Moldova (97.7%, a difference of 0.010%).
| Demographics | Rating | Rank | 4th Grade |
| Immigrants | Greece | 83.8 /100 | #141 | Excellent 97.7% |
| Immigrants | North Macedonia | 83.3 /100 | #142 | Excellent 97.7% |
| Burmese | 82.8 /100 | #143 | Excellent 97.7% |
| Spaniards | 82.7 /100 | #144 | Excellent 97.7% |
| Immigrants | Moldova | 82.4 /100 | #145 | Excellent 97.7% |
| Jordanians | 81.3 /100 | #146 | Excellent 97.7% |
| Ute | 80.6 /100 | #147 | Excellent 97.7% |
| Hopi | 80.6 /100 | #148 | Excellent 97.7% |
| Soviet Union | 77.8 /100 | #149 | Good 97.6% |
| Immigrants | Israel | 77.7 /100 | #150 | Good 97.6% |
| Alsatians | 77.2 /100 | #151 | Good 97.6% |
| Immigrants | South Central Asia | 76.2 /100 | #152 | Good 97.6% |
| Immigrants | Eastern Europe | 71.3 /100 | #153 | Good 97.6% |
| Immigrants | Russia | 67.0 /100 | #154 | Good 97.6% |
| Albanians | 67.0 /100 | #155 | Good 97.6% |