Austrian vs Hopi Householder Income Ages 25 - 44 years
COMPARE
Austrian
Hopi
Householder Income Ages 25 - 44 years
Householder Income Ages 25 - 44 years Comparison
Austrians
Hopi
$101,842
HOUSEHOLDER INCOME AGES 25 - 44 YEARS
98.3/ 100
METRIC RATING
97th/ 347
METRIC RANK
$75,002
HOUSEHOLDER INCOME AGES 25 - 44 YEARS
0.0/ 100
METRIC RATING
333rd/ 347
METRIC RANK
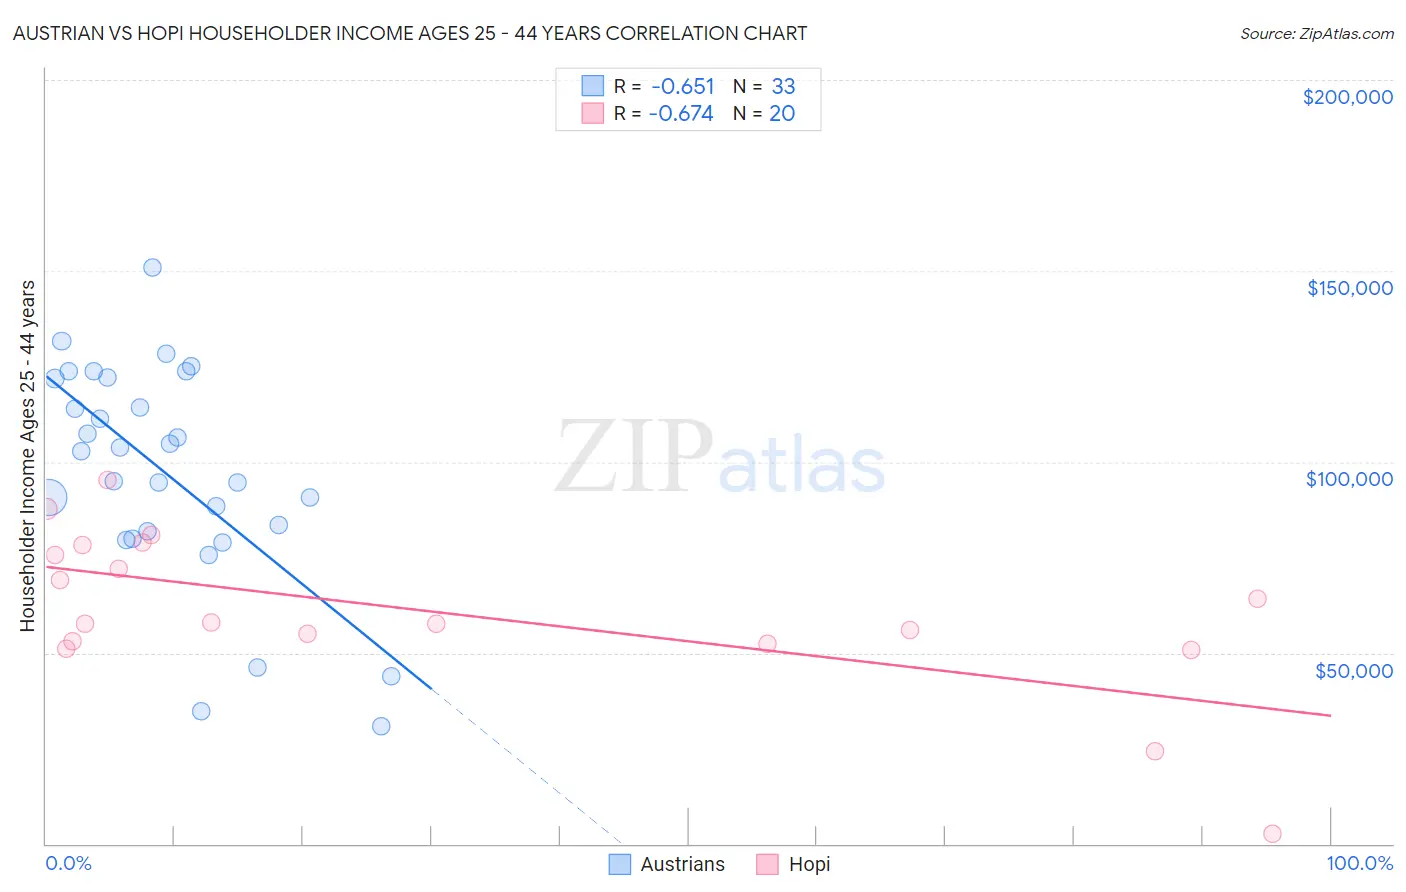
Austrian vs Hopi Householder Income Ages 25 - 44 years Correlation Chart
The statistical analysis conducted on geographies consisting of 450,333,214 people shows a significant negative correlation between the proportion of Austrians and household income with householder between the ages 25 and 44 in the United States with a correlation coefficient (R) of -0.651 and weighted average of $101,842. Similarly, the statistical analysis conducted on geographies consisting of 74,668,880 people shows a significant negative correlation between the proportion of Hopi and household income with householder between the ages 25 and 44 in the United States with a correlation coefficient (R) of -0.674 and weighted average of $75,002, a difference of 35.8%.
Householder Income Ages 25 - 44 years Correlation Summary
| Measurement | Austrian | Hopi |
| Minimum | $30,750 | $2,499 |
| Maximum | $150,833 | $95,278 |
| Range | $120,083 | $92,779 |
| Mean | $97,065 | $61,016 |
| Median | $102,890 | $57,812 |
| Interquartile 25% (IQ1) | $80,830 | $52,840 |
| Interquartile 75% (IQ3) | $121,881 | $76,984 |
| Interquartile Range (IQR) | $41,051 | $24,144 |
| Standard Deviation (Sample) | $28,521 | $21,159 |
| Standard Deviation (Population) | $28,086 | $20,623 |
Similar Demographics by Householder Income Ages 25 - 44 years
Demographics Similar to Austrians by Householder Income Ages 25 - 44 years
In terms of householder income ages 25 - 44 years, the demographic groups most similar to Austrians are Macedonian ($101,882, a difference of 0.040%), Assyrian/Chaldean/Syriac ($101,936, a difference of 0.090%), Immigrants from Kazakhstan ($101,727, a difference of 0.11%), Sri Lankan ($101,960, a difference of 0.12%), and Immigrants from England ($102,020, a difference of 0.17%).
| Demographics | Rating | Rank | Householder Income Ages 25 - 44 years |
| Ukrainians | 98.8 /100 | #90 | Exceptional $102,451 |
| Croatians | 98.7 /100 | #91 | Exceptional $102,414 |
| Immigrants | North America | 98.7 /100 | #92 | Exceptional $102,407 |
| Immigrants | England | 98.4 /100 | #93 | Exceptional $102,020 |
| Sri Lankans | 98.4 /100 | #94 | Exceptional $101,960 |
| Assyrians/Chaldeans/Syriacs | 98.3 /100 | #95 | Exceptional $101,936 |
| Macedonians | 98.3 /100 | #96 | Exceptional $101,882 |
| Austrians | 98.3 /100 | #97 | Exceptional $101,842 |
| Immigrants | Kazakhstan | 98.1 /100 | #98 | Exceptional $101,727 |
| Taiwanese | 97.9 /100 | #99 | Exceptional $101,492 |
| Immigrants | Argentina | 97.8 /100 | #100 | Exceptional $101,415 |
| Albanians | 97.8 /100 | #101 | Exceptional $101,367 |
| Immigrants | Lebanon | 97.4 /100 | #102 | Exceptional $101,124 |
| Immigrants | Moldova | 97.4 /100 | #103 | Exceptional $101,091 |
| Immigrants | Poland | 97.4 /100 | #104 | Exceptional $101,065 |
Demographics Similar to Hopi by Householder Income Ages 25 - 44 years
In terms of householder income ages 25 - 44 years, the demographic groups most similar to Hopi are Creek ($74,847, a difference of 0.21%), Kiowa ($74,776, a difference of 0.30%), Bahamian ($75,395, a difference of 0.52%), Native/Alaskan ($75,647, a difference of 0.86%), and Yakama ($76,226, a difference of 1.6%).
| Demographics | Rating | Rank | Householder Income Ages 25 - 44 years |
| Houma | 0.0 /100 | #326 | Tragic $77,044 |
| Immigrants | Bahamas | 0.0 /100 | #327 | Tragic $76,910 |
| Immigrants | Cuba | 0.0 /100 | #328 | Tragic $76,701 |
| Seminole | 0.0 /100 | #329 | Tragic $76,584 |
| Yakama | 0.0 /100 | #330 | Tragic $76,226 |
| Natives/Alaskans | 0.0 /100 | #331 | Tragic $75,647 |
| Bahamians | 0.0 /100 | #332 | Tragic $75,395 |
| Hopi | 0.0 /100 | #333 | Tragic $75,002 |
| Creek | 0.0 /100 | #334 | Tragic $74,847 |
| Kiowa | 0.0 /100 | #335 | Tragic $74,776 |
| Yup'ik | 0.0 /100 | #336 | Tragic $73,688 |
| Blacks/African Americans | 0.0 /100 | #337 | Tragic $73,370 |
| Immigrants | Yemen | 0.0 /100 | #338 | Tragic $73,043 |
| Yuman | 0.0 /100 | #339 | Tragic $72,956 |
| Immigrants | Congo | 0.0 /100 | #340 | Tragic $72,178 |