Austrian vs Hmong Bachelor's Degree
COMPARE
Austrian
Hmong
Bachelor's Degree
Bachelor's Degree Comparison
Austrians
Hmong
40.6%
BACHELOR'S DEGREE
95.5/ 100
METRIC RATING
117th/ 347
METRIC RANK
34.8%
BACHELOR'S DEGREE
3.4/ 100
METRIC RATING
232nd/ 347
METRIC RANK
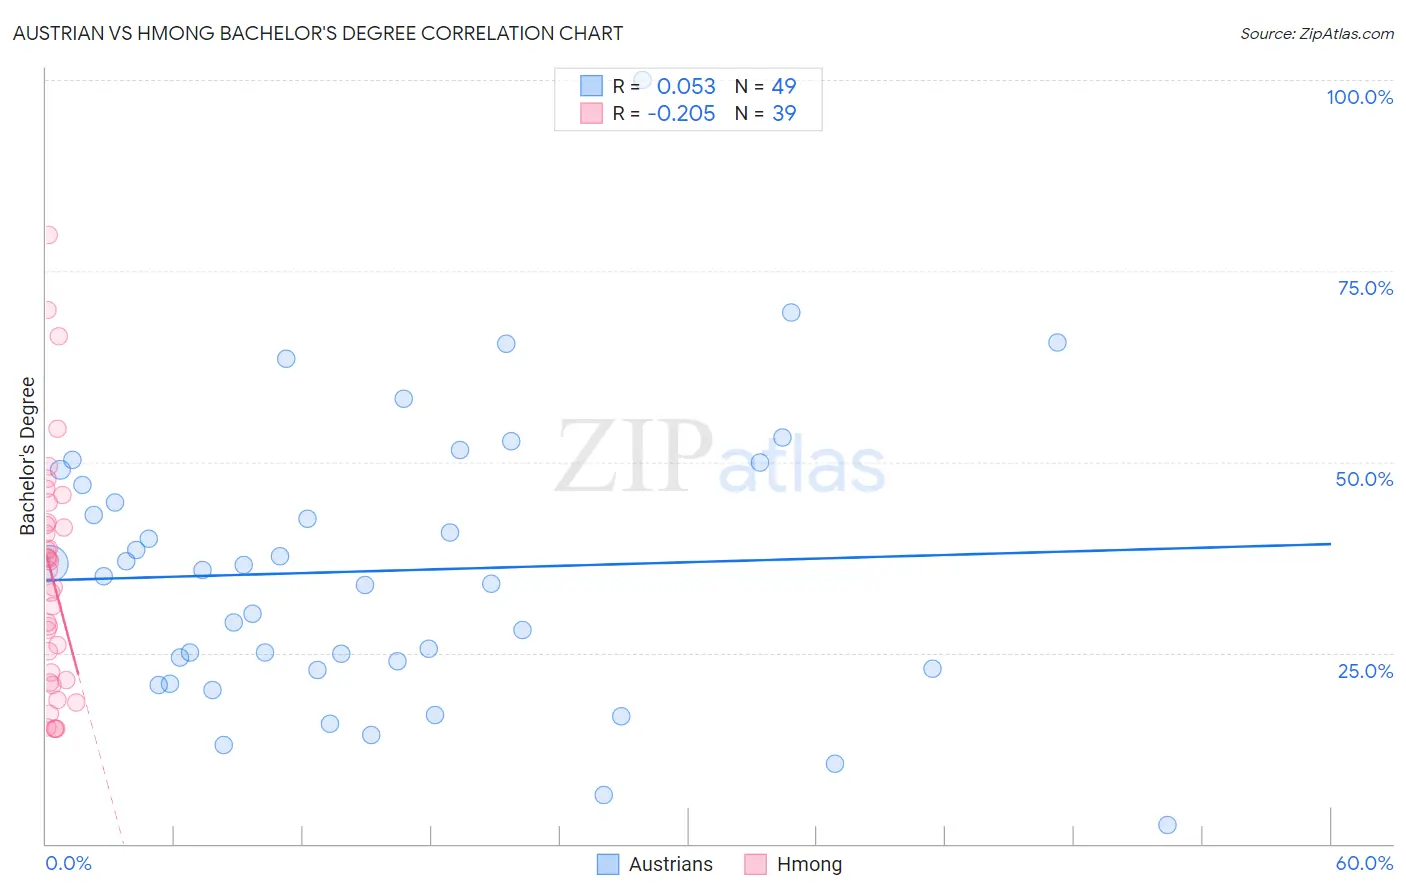
Austrian vs Hmong Bachelor's Degree Correlation Chart
The statistical analysis conducted on geographies consisting of 452,047,267 people shows a slight positive correlation between the proportion of Austrians and percentage of population with at least bachelor's degree education in the United States with a correlation coefficient (R) of 0.053 and weighted average of 40.6%. Similarly, the statistical analysis conducted on geographies consisting of 24,680,511 people shows a weak negative correlation between the proportion of Hmong and percentage of population with at least bachelor's degree education in the United States with a correlation coefficient (R) of -0.205 and weighted average of 34.8%, a difference of 17.0%.
Bachelor's Degree Correlation Summary
| Measurement | Austrian | Hmong |
| Minimum | 2.4% | 15.0% |
| Maximum | 100.0% | 79.7% |
| Range | 97.6% | 64.7% |
| Mean | 35.7% | 35.0% |
| Median | 35.1% | 35.8% |
| Interquartile 25% (IQ1) | 22.9% | 21.5% |
| Interquartile 75% (IQ3) | 48.0% | 42.0% |
| Interquartile Range (IQR) | 25.1% | 20.5% |
| Standard Deviation (Sample) | 18.7% | 15.4% |
| Standard Deviation (Population) | 18.5% | 15.2% |
Similar Demographics by Bachelor's Degree
Demographics Similar to Austrians by Bachelor's Degree
In terms of bachelor's degree, the demographic groups most similar to Austrians are Croatian (40.6%, a difference of 0.020%), Immigrants from Uganda (40.7%, a difference of 0.10%), Palestinian (40.7%, a difference of 0.15%), Immigrants from Syria (40.5%, a difference of 0.34%), and Afghan (40.8%, a difference of 0.39%).
| Demographics | Rating | Rank | Bachelor's Degree |
| Albanians | 96.5 /100 | #110 | Exceptional 40.9% |
| Immigrants | Chile | 96.4 /100 | #111 | Exceptional 40.8% |
| Ugandans | 96.3 /100 | #112 | Exceptional 40.8% |
| Brazilians | 96.3 /100 | #113 | Exceptional 40.8% |
| Afghans | 96.2 /100 | #114 | Exceptional 40.8% |
| Palestinians | 95.8 /100 | #115 | Exceptional 40.7% |
| Immigrants | Uganda | 95.7 /100 | #116 | Exceptional 40.7% |
| Austrians | 95.5 /100 | #117 | Exceptional 40.6% |
| Croatians | 95.5 /100 | #118 | Exceptional 40.6% |
| Immigrants | Syria | 94.9 /100 | #119 | Exceptional 40.5% |
| Venezuelans | 94.7 /100 | #120 | Exceptional 40.5% |
| Moroccans | 94.6 /100 | #121 | Exceptional 40.5% |
| Immigrants | Albania | 94.4 /100 | #122 | Exceptional 40.4% |
| Lebanese | 94.3 /100 | #123 | Exceptional 40.4% |
| Immigrants | Eritrea | 94.3 /100 | #124 | Exceptional 40.4% |
Demographics Similar to Hmong by Bachelor's Degree
In terms of bachelor's degree, the demographic groups most similar to Hmong are Immigrants from Ecuador (34.7%, a difference of 0.11%), Guamanian/Chamorro (34.6%, a difference of 0.32%), Immigrants from West Indies (34.6%, a difference of 0.42%), Liberian (34.6%, a difference of 0.52%), and Tlingit-Haida (34.6%, a difference of 0.56%).
| Demographics | Rating | Rank | Bachelor's Degree |
| Immigrants | Burma/Myanmar | 7.3 /100 | #225 | Tragic 35.5% |
| Portuguese | 7.2 /100 | #226 | Tragic 35.5% |
| Ecuadorians | 6.6 /100 | #227 | Tragic 35.4% |
| Immigrants | Trinidad and Tobago | 6.0 /100 | #228 | Tragic 35.3% |
| Whites/Caucasians | 5.9 /100 | #229 | Tragic 35.3% |
| Immigrants | Grenada | 4.3 /100 | #230 | Tragic 35.0% |
| Immigrants | St. Vincent and the Grenadines | 4.3 /100 | #231 | Tragic 35.0% |
| Hmong | 3.4 /100 | #232 | Tragic 34.8% |
| Immigrants | Ecuador | 3.3 /100 | #233 | Tragic 34.7% |
| Guamanians/Chamorros | 3.0 /100 | #234 | Tragic 34.6% |
| Immigrants | West Indies | 2.9 /100 | #235 | Tragic 34.6% |
| Liberians | 2.8 /100 | #236 | Tragic 34.6% |
| Tlingit-Haida | 2.8 /100 | #237 | Tragic 34.6% |
| Guyanese | 2.5 /100 | #238 | Tragic 34.5% |
| British West Indians | 2.5 /100 | #239 | Tragic 34.5% |