Australian vs Native Hawaiian GED/Equivalency
COMPARE
Australian
Native Hawaiian
GED/Equivalency
GED/Equivalency Comparison
Australians
Native Hawaiians
88.1%
GED/EQUIVALENCY
99.5/ 100
METRIC RATING
49th/ 347
METRIC RANK
87.5%
GED/EQUIVALENCY
98.1/ 100
METRIC RATING
87th/ 347
METRIC RANK
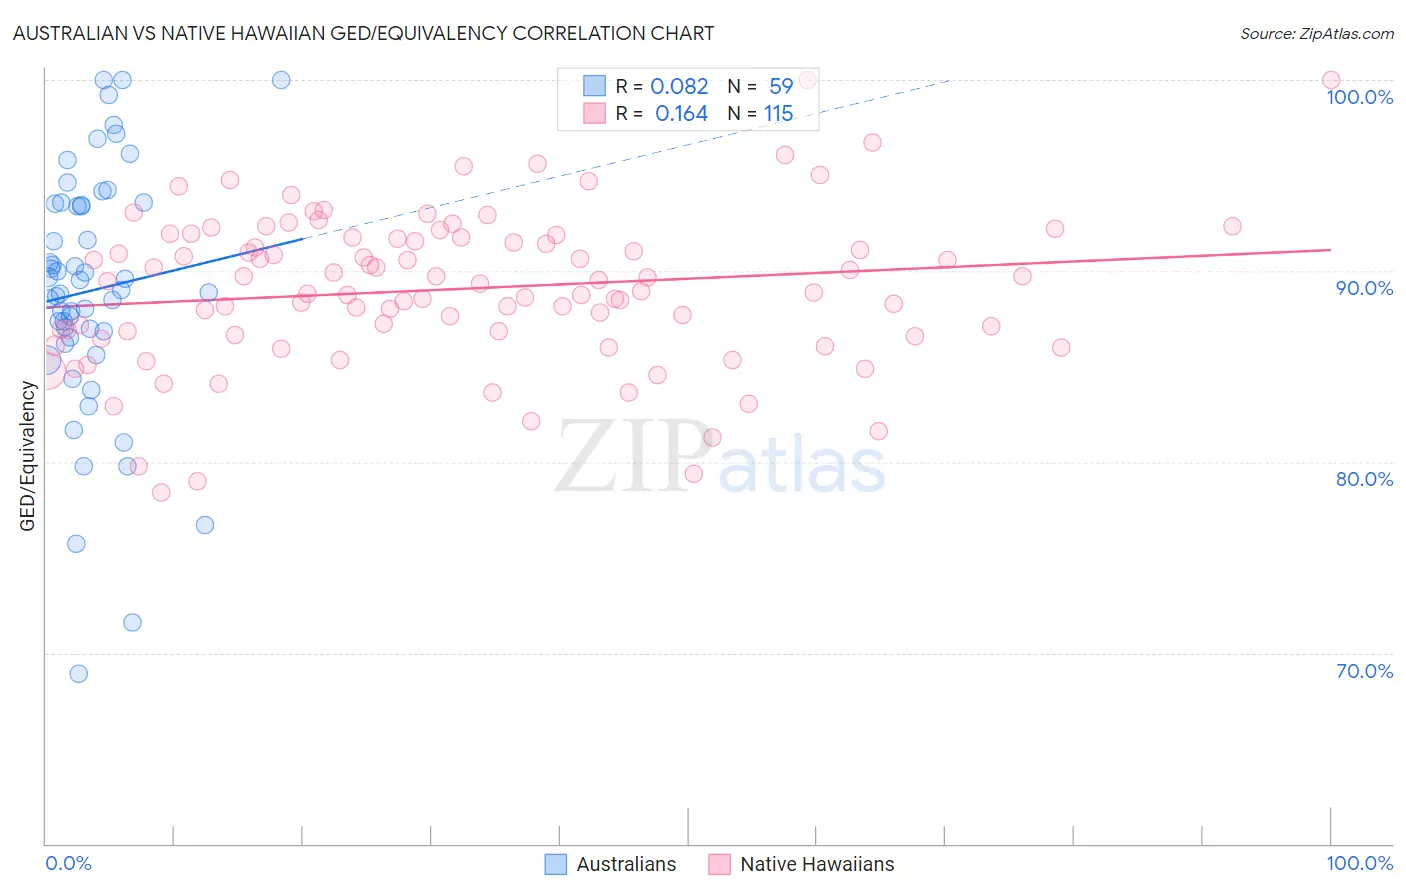
Australian vs Native Hawaiian GED/Equivalency Correlation Chart
The statistical analysis conducted on geographies consisting of 224,163,773 people shows a slight positive correlation between the proportion of Australians and percentage of population with at least ged/equivalency education in the United States with a correlation coefficient (R) of 0.082 and weighted average of 88.1%. Similarly, the statistical analysis conducted on geographies consisting of 332,118,930 people shows a poor positive correlation between the proportion of Native Hawaiians and percentage of population with at least ged/equivalency education in the United States with a correlation coefficient (R) of 0.164 and weighted average of 87.5%, a difference of 0.65%.
GED/Equivalency Correlation Summary
| Measurement | Australian | Native Hawaiian |
| Minimum | 68.9% | 78.4% |
| Maximum | 100.0% | 100.0% |
| Range | 31.1% | 21.6% |
| Mean | 89.0% | 89.1% |
| Median | 89.0% | 89.3% |
| Interquartile 25% (IQ1) | 86.5% | 86.7% |
| Interquartile 75% (IQ3) | 93.6% | 91.8% |
| Interquartile Range (IQR) | 7.0% | 5.1% |
| Standard Deviation (Sample) | 6.5% | 4.0% |
| Standard Deviation (Population) | 6.5% | 4.0% |
Similar Demographics by GED/Equivalency
Demographics Similar to Australians by GED/Equivalency
In terms of ged/equivalency, the demographic groups most similar to Australians are Greek (88.1%, a difference of 0.010%), Immigrants from Korea (88.1%, a difference of 0.010%), Immigrants from Latvia (88.1%, a difference of 0.020%), Immigrants from Switzerland (88.1%, a difference of 0.030%), and Czech (88.1%, a difference of 0.040%).
| Demographics | Rating | Rank | GED/Equivalency |
| Cambodians | 99.6 /100 | #42 | Exceptional 88.2% |
| Immigrants | Scotland | 99.6 /100 | #43 | Exceptional 88.2% |
| Macedonians | 99.5 /100 | #44 | Exceptional 88.1% |
| Czechs | 99.5 /100 | #45 | Exceptional 88.1% |
| Immigrants | Switzerland | 99.5 /100 | #46 | Exceptional 88.1% |
| Immigrants | Latvia | 99.5 /100 | #47 | Exceptional 88.1% |
| Greeks | 99.5 /100 | #48 | Exceptional 88.1% |
| Australians | 99.5 /100 | #49 | Exceptional 88.1% |
| Immigrants | Korea | 99.5 /100 | #50 | Exceptional 88.1% |
| Immigrants | Netherlands | 99.4 /100 | #51 | Exceptional 88.0% |
| Zimbabweans | 99.4 /100 | #52 | Exceptional 88.0% |
| Immigrants | South Africa | 99.4 /100 | #53 | Exceptional 88.0% |
| Soviet Union | 99.4 /100 | #54 | Exceptional 88.0% |
| New Zealanders | 99.4 /100 | #55 | Exceptional 88.0% |
| Immigrants | Denmark | 99.4 /100 | #56 | Exceptional 88.0% |
Demographics Similar to Native Hawaiians by GED/Equivalency
In terms of ged/equivalency, the demographic groups most similar to Native Hawaiians are Immigrants from Europe (87.5%, a difference of 0.0%), Immigrants from Romania (87.5%, a difference of 0.010%), Dutch (87.5%, a difference of 0.010%), Immigrants from Norway (87.5%, a difference of 0.010%), and Hungarian (87.4%, a difference of 0.050%).
| Demographics | Rating | Rank | GED/Equivalency |
| Immigrants | England | 98.5 /100 | #80 | Exceptional 87.6% |
| Immigrants | Sri Lanka | 98.3 /100 | #81 | Exceptional 87.5% |
| Romanians | 98.3 /100 | #82 | Exceptional 87.5% |
| South Africans | 98.3 /100 | #83 | Exceptional 87.5% |
| Immigrants | Romania | 98.1 /100 | #84 | Exceptional 87.5% |
| Dutch | 98.1 /100 | #85 | Exceptional 87.5% |
| Immigrants | Europe | 98.1 /100 | #86 | Exceptional 87.5% |
| Native Hawaiians | 98.1 /100 | #87 | Exceptional 87.5% |
| Immigrants | Norway | 98.1 /100 | #88 | Exceptional 87.5% |
| Hungarians | 97.9 /100 | #89 | Exceptional 87.4% |
| Welsh | 97.9 /100 | #90 | Exceptional 87.4% |
| Immigrants | Eastern Asia | 97.9 /100 | #91 | Exceptional 87.4% |
| Israelis | 97.8 /100 | #92 | Exceptional 87.4% |
| Immigrants | North Macedonia | 97.8 /100 | #93 | Exceptional 87.4% |
| Immigrants | Russia | 97.8 /100 | #94 | Exceptional 87.4% |