Assyrian/Chaldean/Syriac vs Syrian 12th Grade, No Diploma
COMPARE
Assyrian/Chaldean/Syriac
Syrian
12th Grade, No Diploma
12th Grade, No Diploma Comparison
Assyrians/Chaldeans/Syriacs
Syrians
91.8%
12TH GRADE, NO DIPLOMA
89.6/ 100
METRIC RATING
130th/ 347
METRIC RANK
92.2%
12TH GRADE, NO DIPLOMA
97.2/ 100
METRIC RATING
107th/ 347
METRIC RANK
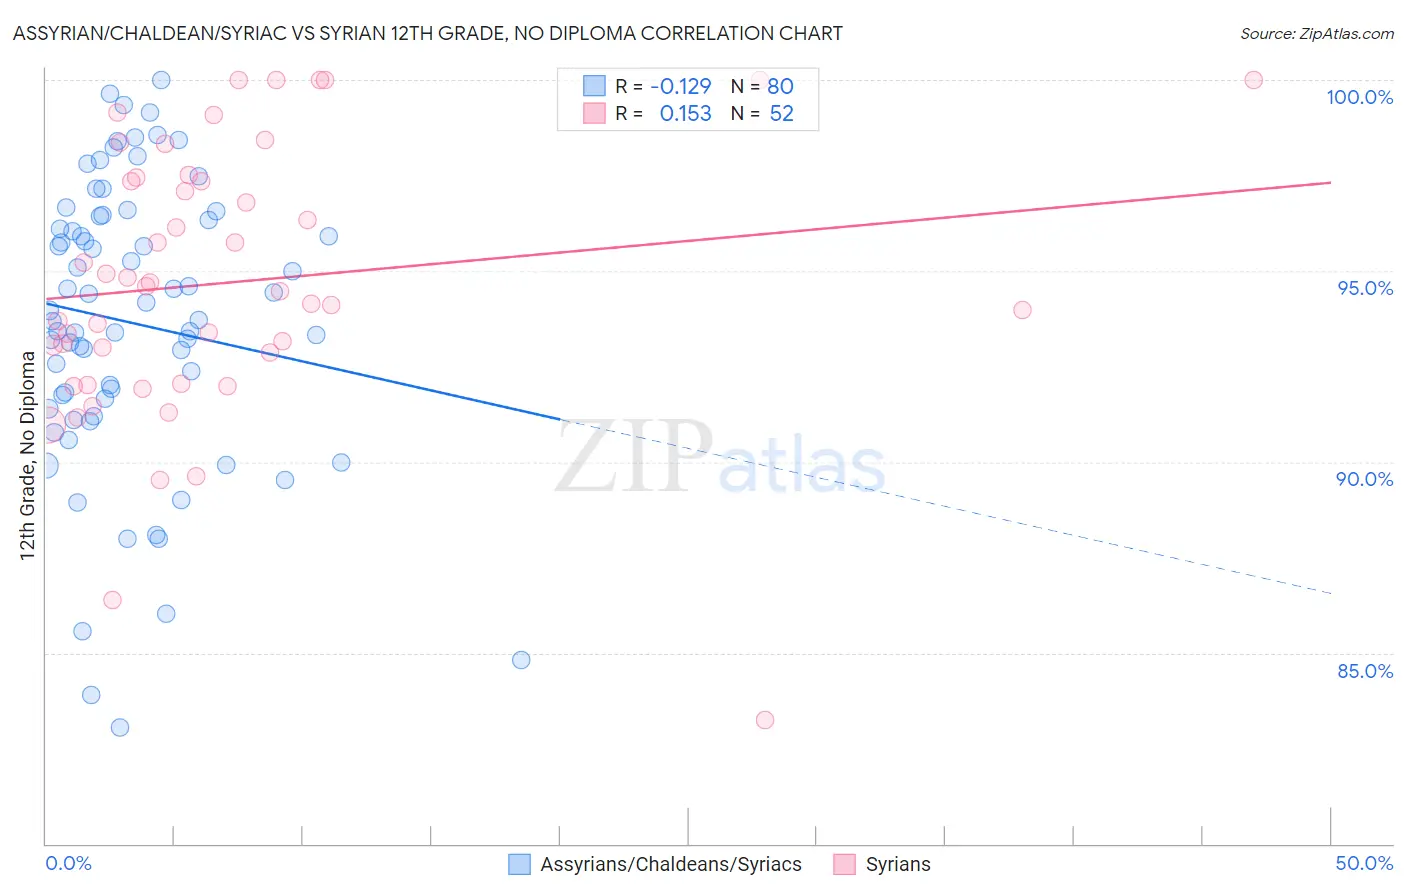
Assyrian/Chaldean/Syriac vs Syrian 12th Grade, No Diploma Correlation Chart
The statistical analysis conducted on geographies consisting of 110,318,125 people shows a poor negative correlation between the proportion of Assyrians/Chaldeans/Syriacs and percentage of population with at least 12th grade (no diploma) education in the United States with a correlation coefficient (R) of -0.129 and weighted average of 91.8%. Similarly, the statistical analysis conducted on geographies consisting of 266,306,452 people shows a poor positive correlation between the proportion of Syrians and percentage of population with at least 12th grade (no diploma) education in the United States with a correlation coefficient (R) of 0.153 and weighted average of 92.2%, a difference of 0.43%.
12th Grade, No Diploma Correlation Summary
| Measurement | Assyrian/Chaldean/Syriac | Syrian |
| Minimum | 83.1% | 83.2% |
| Maximum | 100.0% | 100.0% |
| Range | 16.9% | 16.8% |
| Mean | 93.6% | 94.7% |
| Median | 93.8% | 94.5% |
| Interquartile 25% (IQ1) | 91.5% | 92.5% |
| Interquartile 75% (IQ3) | 96.4% | 97.4% |
| Interquartile Range (IQR) | 4.9% | 5.0% |
| Standard Deviation (Sample) | 3.8% | 3.6% |
| Standard Deviation (Population) | 3.7% | 3.5% |
Similar Demographics by 12th Grade, No Diploma
Demographics Similar to Assyrians/Chaldeans/Syriacs by 12th Grade, No Diploma
In terms of 12th grade, no diploma, the demographic groups most similar to Assyrians/Chaldeans/Syriacs are German Russian (91.8%, a difference of 0.0%), Mongolian (91.8%, a difference of 0.010%), Albanian (91.8%, a difference of 0.010%), Immigrants from Eastern Asia (91.8%, a difference of 0.010%), and Immigrants from Italy (91.7%, a difference of 0.040%).
| Demographics | Rating | Rank | 12th Grade, No Diploma |
| Egyptians | 92.5 /100 | #123 | Exceptional 91.9% |
| Immigrants | Ukraine | 91.6 /100 | #124 | Exceptional 91.8% |
| Whites/Caucasians | 91.6 /100 | #125 | Exceptional 91.8% |
| Basques | 91.3 /100 | #126 | Exceptional 91.8% |
| Immigrants | Jordan | 91.0 /100 | #127 | Exceptional 91.8% |
| Mongolians | 89.9 /100 | #128 | Excellent 91.8% |
| German Russians | 89.8 /100 | #129 | Excellent 91.8% |
| Assyrians/Chaldeans/Syriacs | 89.6 /100 | #130 | Excellent 91.8% |
| Albanians | 89.3 /100 | #131 | Excellent 91.8% |
| Immigrants | Eastern Asia | 89.3 /100 | #132 | Excellent 91.8% |
| Immigrants | Italy | 88.3 /100 | #133 | Excellent 91.7% |
| Venezuelans | 88.2 /100 | #134 | Excellent 91.7% |
| Immigrants | Bosnia and Herzegovina | 87.3 /100 | #135 | Excellent 91.7% |
| Chileans | 85.8 /100 | #136 | Excellent 91.7% |
| Alaska Natives | 84.9 /100 | #137 | Excellent 91.6% |
Demographics Similar to Syrians by 12th Grade, No Diploma
In terms of 12th grade, no diploma, the demographic groups most similar to Syrians are Immigrants from Russia (92.2%, a difference of 0.010%), Jordanian (92.2%, a difference of 0.010%), Immigrants from Belarus (92.2%, a difference of 0.020%), Immigrants from Hungary (92.1%, a difference of 0.020%), and Palestinian (92.1%, a difference of 0.030%).
| Demographics | Rating | Rank | 12th Grade, No Diploma |
| Immigrants | Croatia | 98.3 /100 | #100 | Exceptional 92.3% |
| Swiss | 98.1 /100 | #101 | Exceptional 92.3% |
| Alaskan Athabascans | 98.1 /100 | #102 | Exceptional 92.3% |
| Immigrants | Norway | 98.1 /100 | #103 | Exceptional 92.3% |
| Lebanese | 97.6 /100 | #104 | Exceptional 92.2% |
| Immigrants | Belarus | 97.4 /100 | #105 | Exceptional 92.2% |
| Immigrants | Russia | 97.3 /100 | #106 | Exceptional 92.2% |
| Syrians | 97.2 /100 | #107 | Exceptional 92.2% |
| Jordanians | 97.2 /100 | #108 | Exceptional 92.2% |
| Immigrants | Hungary | 97.0 /100 | #109 | Exceptional 92.1% |
| Palestinians | 97.0 /100 | #110 | Exceptional 92.1% |
| Immigrants | Greece | 96.9 /100 | #111 | Exceptional 92.1% |
| Israelis | 96.8 /100 | #112 | Exceptional 92.1% |
| Immigrants | Zimbabwe | 96.5 /100 | #113 | Exceptional 92.1% |
| Yugoslavians | 96.5 /100 | #114 | Exceptional 92.1% |